Figure 3.
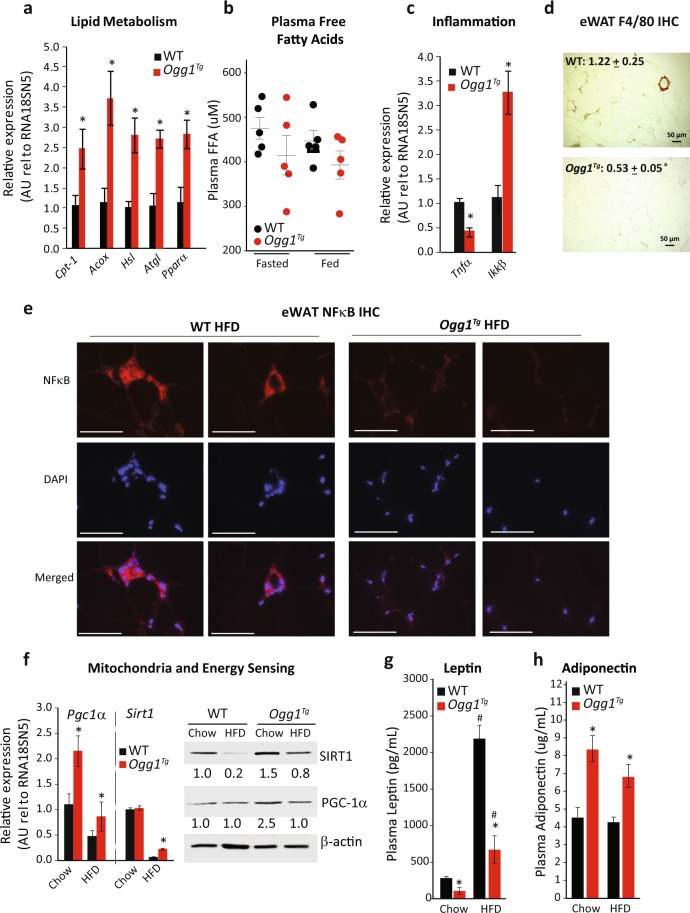
Adipose tissue metabolism is altered in Ogg1Tg mice. Metabolic parameters were determined in eWAT of WT and Ogg1Tg mice (n = 6, unless otherwise indicated). Expression of genes regulating lipid catabolism (a), inflammation (c), and mitochondrial energy metabolism (f) was quantitated by qRT-PCR using gene-specific primers. Plasma FFA were determined in HFD-fed and overnight-fasted mice (n = 5) using a colorimetric kit (b). Macrophage infiltration into eWAT sections was determined by immunohistochemistry using an antibody against the macrophage protein F4/80, and staining intensity, quantified in ImageJ, is shown in the top left corner of images (d). In addition, protein levels of the inflammatory protein NFκB was determined by IHC using an antibody against NFκB, followed by counterstaining with DAPI (e). Protein levels of SIRT-1 and PGC-1α were determined by SDS-PAGE (f), and β-actin was utilized as a loading control. Plasma leptin (g) and adiponectin (h) levels were determined by ELISA. Data are expressed as average ± SEM. *p < 0.05 vs. WT mice; #p < 0.05 vs. chow-fed mice. Acox, acyl-CoA oxidase, Atgl, adipose triglyceride lipase, Cpt-1, carnitine palmitoyl transferase-1, eWAT, epididymal white adipose tissue, FFA, free fatty acids, Hsl, hormone-sensitive lipase, Pgc-1α, PPAR-gamma coactivator-1 alpha, Pparα, peroxisome proliferator activated receptor-alpha, Sirt1, sirtuin 1.

