Fig. 1.
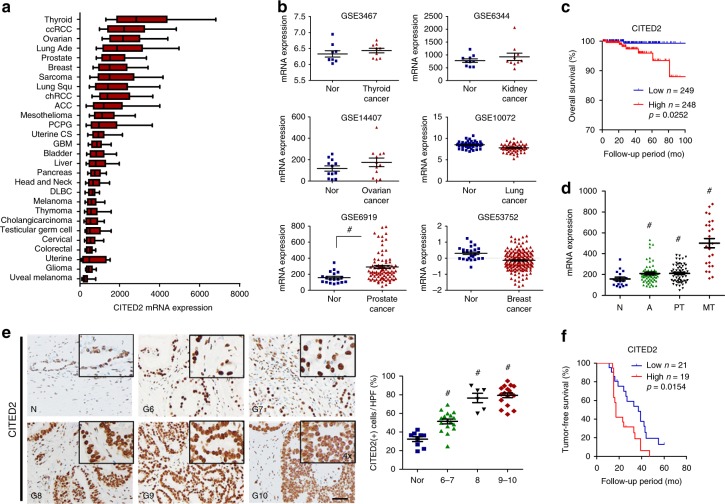
CITED2 overexpression is associated with poor prognosis in prostate cancer. a CITED2 mRNA expression in 28 different types of cancer as determined by RNA-Seq V2 RSEM. Box plots indicate the distribution of values and the middle thick line in the box shows mean value and whiskers represent 10–90th percentile. Results were obtained from The Cancer Genome Atlas (TCGA) cancer provisional data sets based on TCGA Research Network (http://cancergenome.nih.gov). The abbreviations and the number of patients are described in the Methods section. b CITED2 mRNA levels in normal (blue squares) and cancer tissues (red triangles) of thyroid, kidney, ovarian, lung, prostate, and breast (GSE data sets). c Kaplan–Meier overall survival analysis of prostate cancer patients on TCGA. P value was calculated by log-rank test. d CITED2 mRNA levels in human prostate cancer tissues of data set GES6919. N normal prostate tissue (blue squares), A normal prostate tissue adjacent tumor tissue (green triangles), PT prostate primary tumor tissue (black inverted triangles), MT metastatic prostate tumor tissue (red diamond). e Representative images of human prostate adenocarcinoma tissues immunostained with anti-CITED2 antibody. Abbreviations at the left bottoms of images: N normal prostate tissue (blue squares), G6–10 (6–7, green triangles; 8, black inverted triangles; 9–10, red diamond) Gleason scores 6–10 of prostate cancer (left panel). The immunostaining scores were calculated by counting stained cells and presented as dot plots (right panel). The scale bar represents 50 μm. f Kaplan–Meier tumor-free survival analysis of prostate cancer patients. P value was calculated by log-rank test. The horizontal lines in all dot plots represent the means ± SE and #P < 0.05 versus the normal tissue group by Mann–Whitney statistical analysis

