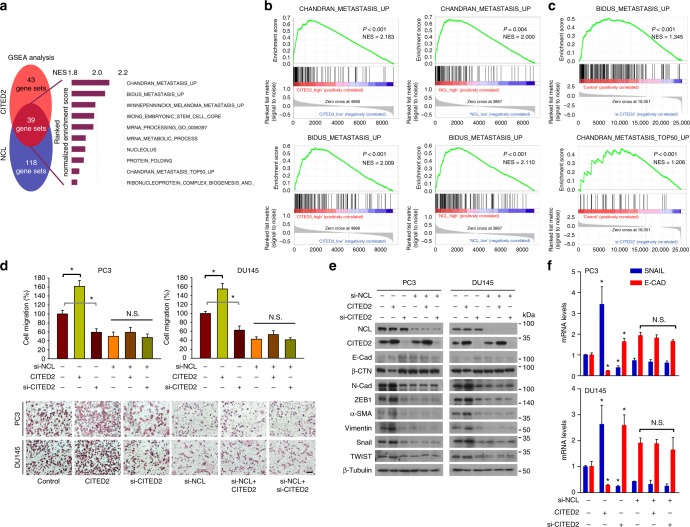
Fig. 5.
CITED2 enhances metastatic potential NCL-dependently in prostate cancer. a Gene Set Enrichment Analysis (GSEA). Venn diagram depicts 39 gene sets upregulated (P < 0.05 and FDR < 0.30) commonly by CITED2 and NCL expression. Of them, top 10 gene sets are listed. b Representative enrichment plots of the metastasis-related gene set which positively correlate with CITED2 (left panel) or NCL (right panel). c PC3 cells were transfected with control or CITED2-targeting siRNA. Total RNAs were extracted using Trizol and subjected to RNA-sequencing analyses. The experiments were performed three times independently. The graphs show representative enrichment plots of the metastasis-related gene set which positively correlate with CITED2 in PC3 cell. d Cell migration was analyzed using a transwell chamber. PC3 and DU145 cells (1 × 10⁴/well), which had been transfected as indicated, were placed on the upper chamber. After 12 h, cells passing through the interface membrane were stained (bottom) and counted (top). Each bar represents the mean + SD (n = 3). The scale bar represents 25 μm. e PC3 and DU145 cells were transfected with CITED2 or si-CITED2, and/or si-NCL. Representative EMT markers were immunoblotted. f RNAs were extracted from PC3 or DU145 cells which were transfected with CITED2 or si-CITED2 and/or si-NCL. The SNAIL and E-CAD mRNA levels were measured by RT-qPCR. Each bar represents the mean + SD (n = 3). *P < 0.05 versus the control group; N.S. not significantly different’ among the groups by Student’s t-test

