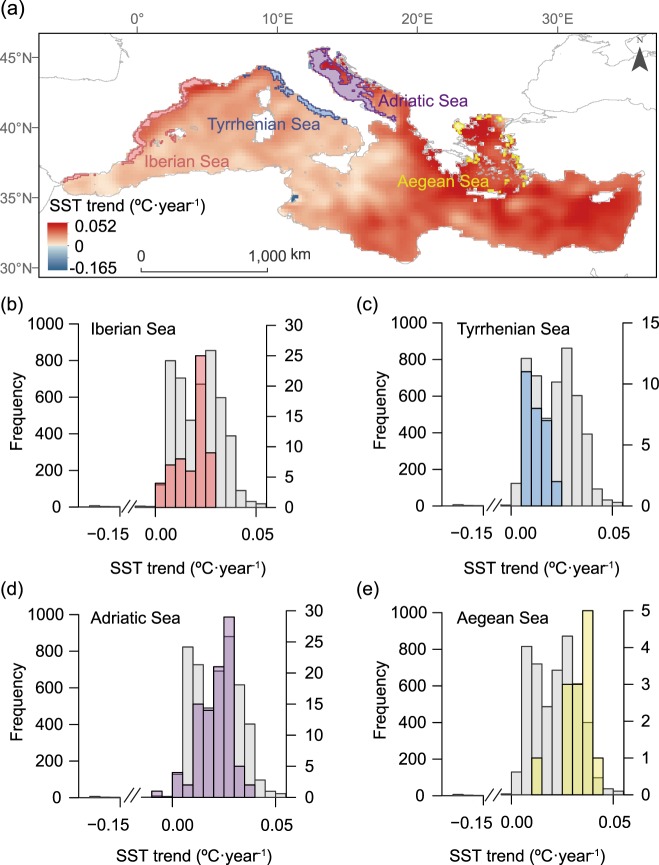
Figure 3.
Ocean warming and industrial fisheries: two stressors impacting fish stocks synergistically. Spatial overlap between the distribution of fishing pressure and the long term (1982–2016) trend in mean winter values (from January 1st to March 31th) of sea surface temperature -SST- (a). Fishing pressure is particularly high at four different coastal areas (each marked in a different color; fishing pressure >4th quartile; from East to West): (b) the Iberian coast, (c) Tyrrhenian Sea, (d) Adriatic Sea and (e) Aegean Sea. The histograms represent the frequency distribution of estimated slopes for pixel-based long-term trends (linear regressions in °C·year−1) of winter SST for the whole Mediterranean Sea (in grey, left y-axis) and for different fishing hotspots (colored bars, right y-axis).

