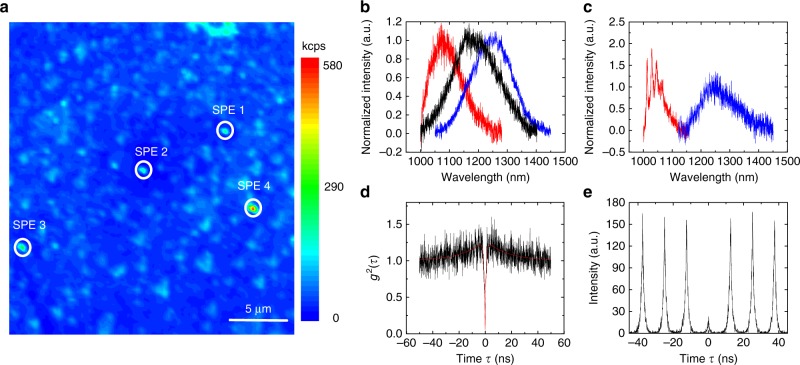
Fig. 1.
3C-SiC single-photon emitters. a 25 × 25 µm2 confocal can map of the SPEs found in 3C SiC epitaxy layer under 2 mW laser excitation. The scale bar is 5 µm. SPEs are marked with white circles. b Three representative RT PL spectrums of the SPEs. c Two representative PL spectrums of the SPEs at cryogenic temperature (5 K). d Second-order autocorrelation function of SPE 4 with g2(0) = 0.05 ± 0.03 under 0.2 mW continuous wave (CW) laser excitation. The black line is the raw data and red solid line is the fitting with Eq. (1). e Second-order autocorrelation function of SPE 4 with g2(0) = 0.13 ± 0.02 under pulsed laser excitation (50 µW)

