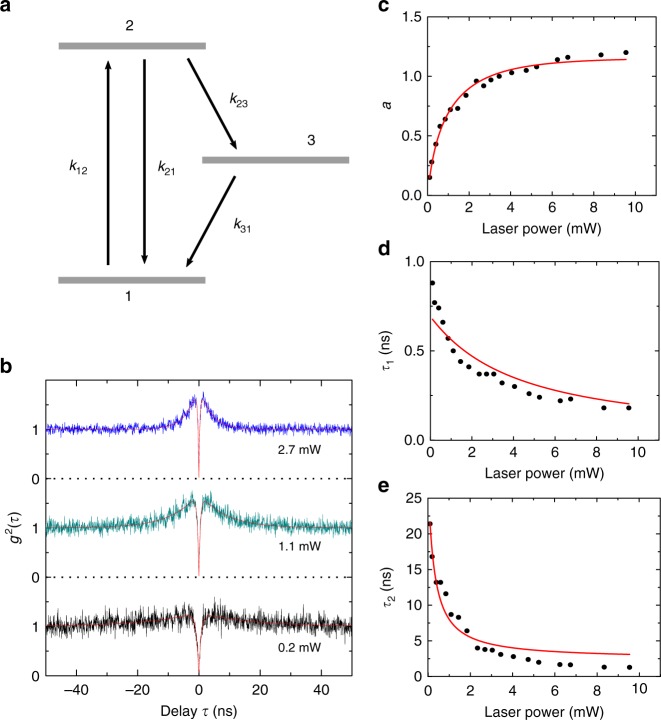
Fig. 3.
Energy level analysis for SPEs. a Three-level model of the SPEs with ground state |1> , excited state |2> , and metastable state |3> . The parameter k12 is the excitation rate from ground state |1> to excited state |2> , and other kij parameters represent the decay rate from state |i> to |j> , where i, j are number from 1 to 3. b Three representative CW second-order autocorrelation function measurements with different laser excitation powers. The red lines are the fitting using the Eq. (1). c, d, e The fitting parameters a, τ1 and τ2 of the antibunching curve as a function of excitation power. The red lines are the fitting of the data

