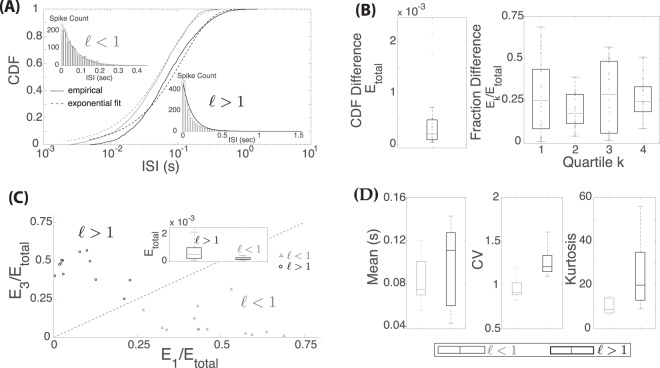
Figure 1.
Comparison of ISI Distribution to Exponential Distributions. (A) Distributions of two ISI data sets in comparison to fitted exponential distributions. (B) Differences between empirical and best-fit exponential CDFs, Etotal and the fractional difference by quartiles Ek/Etotal. (C) Clustering of data by CDF differences in the first quartile E1 versus the third quartile E3. (D) Box plot of mean, CV and kurtosis of ISI data sets with < 1 (in gray) and > 1 (black).

