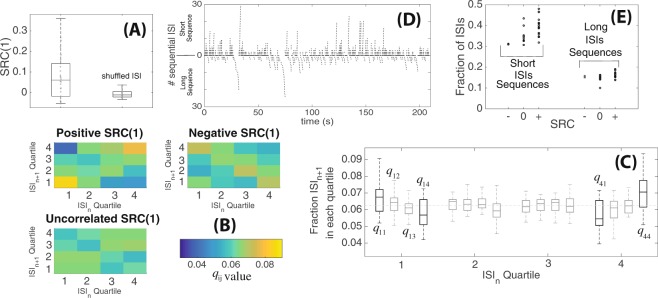
Figure 3.
Dependencies between sequential ISIs. (A) Box plot of SRC for consecutive ISI pairs (SRC(1)) for original unsorted data sets and shuffled data set. (B) Visualizations of the renewal quartile matrix qij showing frequencies for an ISI at a given quartile (horizontal axis) to be followed by an ISI at another quartile (vertical axis). Three qualitatively different mappings can be seen for data sets with positive correlation, zero correlation and negative correlations. (C) Boxplot of entries of renewal quartile matrices across all data sets. Compared to an equal likelihood for any ISI to fall in any quartile (qij = 1/16 shown as dashed line), we saw overall increases in q11 (short followed by short) and q44 (long-long), while q14 (short-long) and q41 (long-short) were reduced. (D) Groupings of long and short ISIs that occur consecutively in sequence over time. (E) Fraction of ISIs that are found within long and short sequences for data sets with negative, zero (uncorrelated), and positive SRC(1) (each dot represent a dataset).

