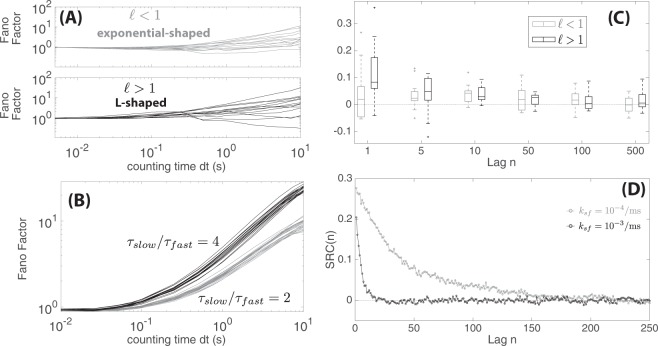
Figure 5.
Long term dependencies between consecutive spikes in lateral-line data and the two-state switching model. (A) Fano factor as a function of counting time for the lateral line data (each curve corresponded to a dataset). (B) Fano factor obtained from simulating the two-state switching model using two different synaptic release time ratios: top: τfast = 40 ms, and τslow = 80/ms and bottom: τfast = 40 ms, and τslow = 160/ms. (All other parameter values were fixed: ksf = 10−4/ms, pfast = 0.4, kfs = ksf (1 − pfast)/pfast, tabs = 2 ms, and trel = 2 ms). (C) SRC(n) at different lag time n (see definition in Eqn 9) for the lateral line data. (D) SRC(n) at different lag time n obtained from simulating the two-state switching model using two different values of switching rates ksf = 10−3/ms in black and ksf = 10−4/ms in gray (all other parameter values were fixed: τfast = 40 ms, pfast = 0.4, τslow = 200 ms, tabs = 2 ms, and trel = 2 ms). Each dot corresponded to the mean SRC(n) value from simulating 100 trials with each trial consisting of 2000 ISIs).

