Figure 6.
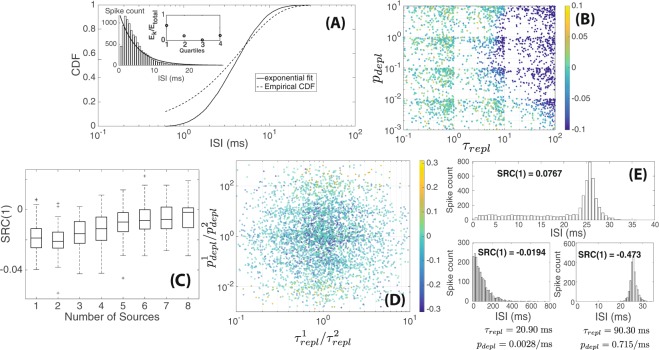
Simulation results from the depletion-replenishment model. (A) Comparison of ISI distribution generated from the model under synaptic depletion (τrepl = 2.5 ms, pdepl = 0.08/ms, nmax = 4, 10,000 ISIs were generated) in comparison to the best-fit exponential distribution (analogous to Fig. 1A). Due to synaptic depletion, shorter ISI becomes less likely (). (B) Colormap of SRC(1) values obtained by random sampling of values for τrepl and pdepl (nmax was fixed at 4). Each dot corresponded to a trial with 2000 ISIs generated; a total of 2000 dots/trials were generated. (C) The effects of varying the number of sources or hair cells on SRC(1) values. Each boxplot consisted of 100 trials where 2000 ISIs were generated per trial (τrepl = 2.5 ms, pdepl = 0.08/ms and nmax = 4 for all sources). (D) Colormap of SRC(1) values obtained when parameters associated with the two different sources were allowed to vary from one another. Ratios of pdepl and τrepl between the two sources are used as axis values. Each dot corresponded to a trial with 2000 ISIs generated; a total of 4440 dots/trials are shown. (E) Top: Shape of ISI distribution obtained with two sources with parameter values chosen to give rise to SRC(1) > 0. Bottom: Shape of ISI distributions if only the first or second source generated spikes in the absence of the other ( ms, /ms, ms, /ms ; 2000 spikes were generated for each histogram).

