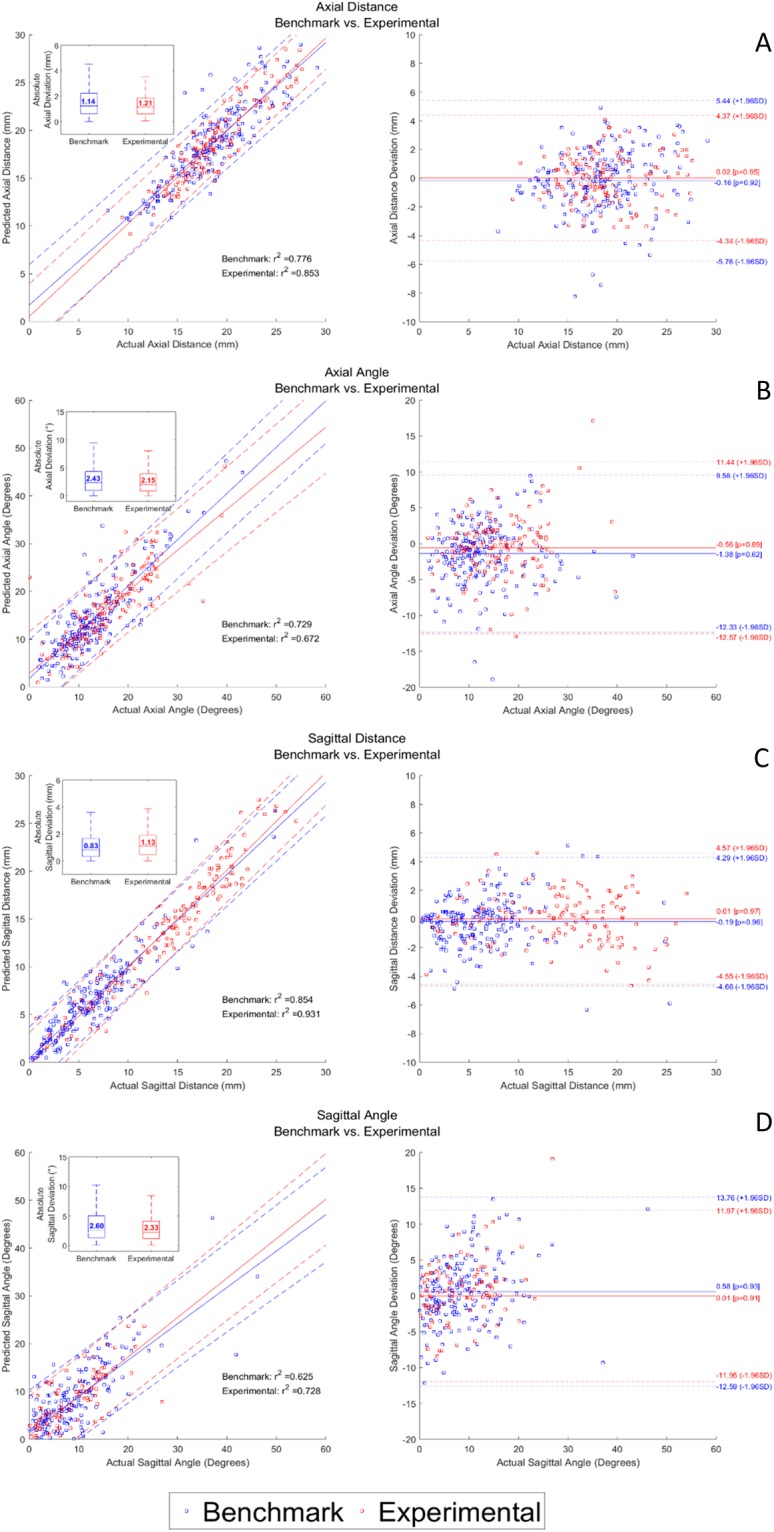
Figure 6.

Bland Altman analysis. Left Panel: Correlation plots with corresponding boxplots comparing predicted intraoperative screw trajectory with actual postoperative screw trajectory for benchmark (blue) and experimental (red) navigation systems. Right Panel: Bland-Altman plots comparing actual screw trajectory with distance and angular deviations for (A) Axial Distance, (B) Sagittal Distance, (C) Axial Angle, (D) Sagittal Angle. No statistically significant differences were found.
