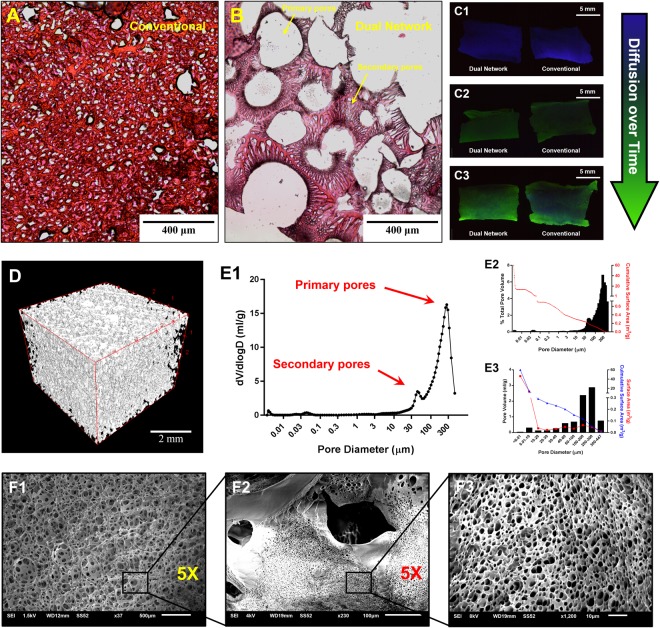
Figure 3.
The light microscope images of the cross-sections of conventional (A) and dual network (B) scaffolds prepared and stained using standard histology/tissue processing protocols. The diffusion of fluorescein sodium salt as the model substance into the conventional and dual network scaffolds after 0 (C1), 0.5 (C2) and 1.5 (C3) h immersion in 10 µg/ml aqueous solution. Micro-CT 3D image of the dual network scaffold (D). Pore size distribution profile of the dual network scaffold (E1), % total pore volume and cumulative surface area as a function of pore size (E2) as well as pore volume, surface area and cumulative surface area for different ranges of pore size (E3) obtained by mercury intrusion porosimetry. The SEM images of primary pores (F1), porous wall of a primary pore (F2) and the opening of the secondary pores (F3) of the dual network scaffold.

