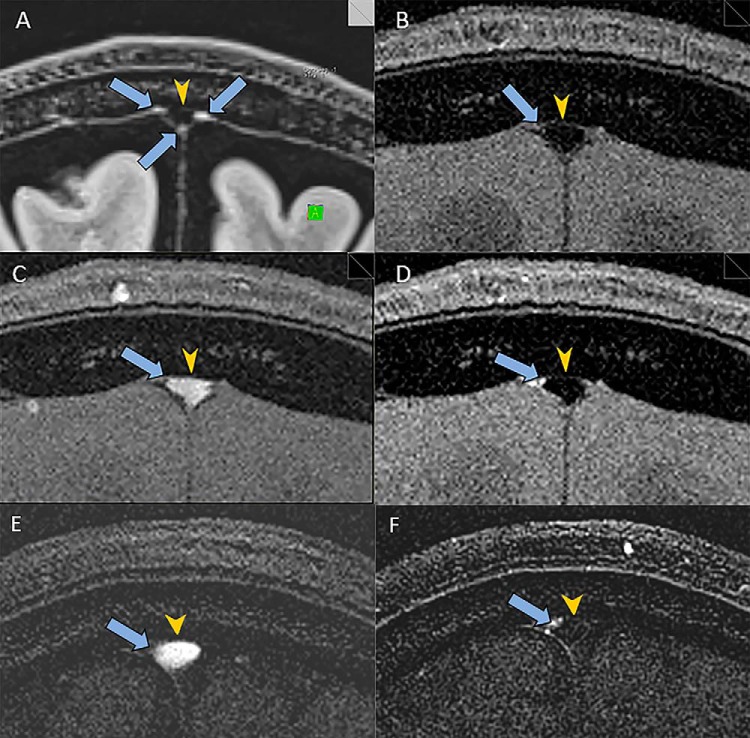
Figure 2.
Utilization of MRI to determine the direction of flow in MLVs of a 45-year-old man. High-resolution coronal SPACE FLAIR image shows MLVs (arrows) adjacent to the SSS (arrowhead) (A). Coronal TOF sequence with saturation bands both anterior and posterior to the image section shows the expected low signal in the SSS (arrowhead) and no signal in the region of the MLVs (arrows) (B). Coronal TOF sequence with a saturation band posterior to the image section shows bright signal in the SSS (arrowhead). The MLV are not visualized (arrows) (C). Coronal TOF sequence with a saturation band anterior to the image section shows the expected low signal in the SSS (arrowhead) (D). MLVs show increased signal consistent (arrows) with rostral flow of the lymphatic fluid posterior to anterior, countercurrent to the venous flow in the SSS. Difference image generated by subtracting coronal TOF sequence with a saturation band posterior (C) from coronal TOF sequence with saturation bands both anterior and posterior (B) shows the expected flow-related enhancement in the SSS only (arrowhead) and not in the MLV (arrow) (E). Difference image generated by subtracting coronal TOF sequence with a saturation band anterior (D) from coronal TOF sequence with saturation bands both anterior and posterior (B) shows more clearly the flow-related enhancement in the MLV (arrow) and lack of enhancement in the SSS (arrowhead) (F).

