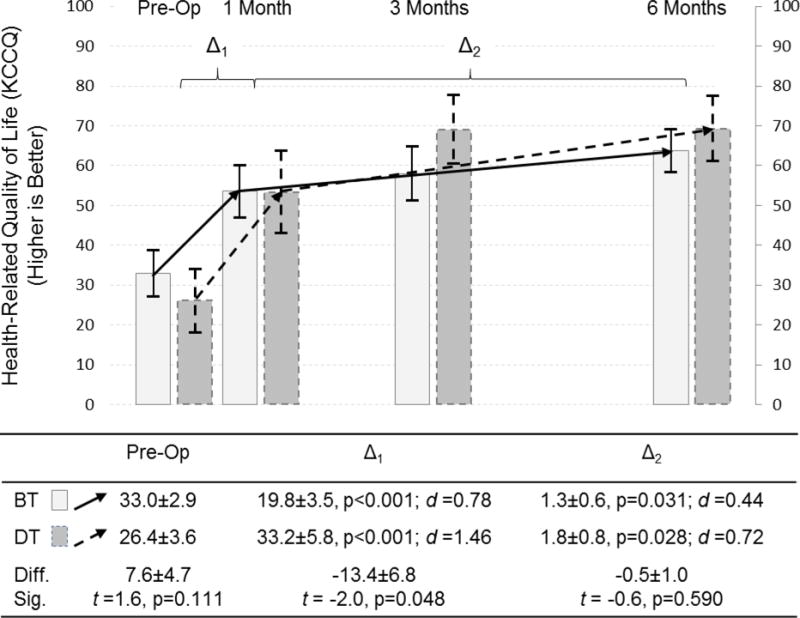
Figure 1. Changes in quality of life in response to LVAD by implant strategy.

Changes in quality of life, as measured by 3-items of the Kansas City Cardiomyopathy Questionnaire, are depicted comparing pre-operative assessment with measure taken at 1, 3 and 6 months after LVAD; the mean and 95% confidence interval is represented by column height and the high and low whisker bars, respectively. Solid lines and lighter bar graphs represent bridge therapy patients, and dashed lines and darker bars represent destination therapy patients. Two phases of change in quality of life are depicted; the initial response to LVAD between pre-implant and 1 month post-implant (Δ1), and the subsequent change between 1 and 6 months post-implant (Δ2). The effect size of each phase of change is presented as Cohen’s d (d) (0.2–0.3 = small, ≈ 0.5 = moderate, and ≥ 0.8 = large effect). The difference (diff) and significance thereof (sig) of HRQOL pre-implant and during each phase of change between destination and bridge therapy patients are presented below the figure.
Abbreviations: BT = bridge therapy; Diff. = difference; DT = destination therapy; KCCQ = Kansas City Cardiomyopathy Questionnaire; LVAD = left ventricular assist device; Sig. = significance; t = t-test.
