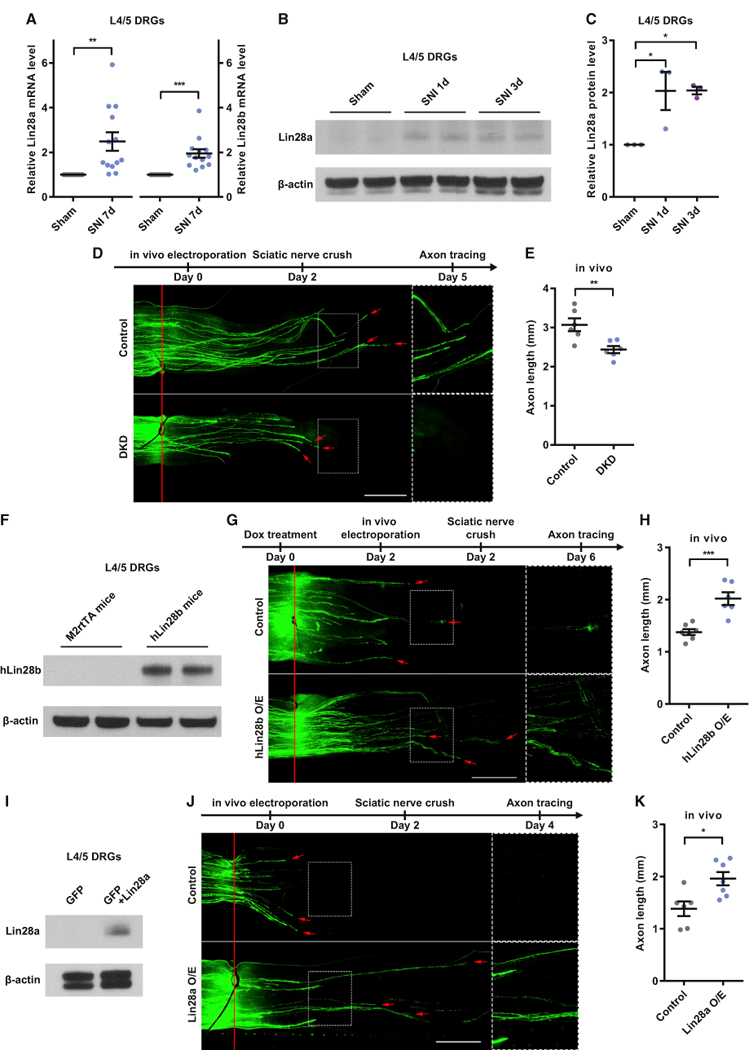
Figure 1. Upregulation of Lin28a/b Is Both Necessary and Sufficient for Sensory Axon Regeneration In Vivo.

(A) Lin28a/b mRNA levels were significantly increased in L4/5 DRGs 7 days after SNI (one-sample t test, p = 0.0039 for Lin28a, p = 0.0003 for Lin28b, n = 13 independent experiments).
(B) Representative western blot result showing a markedly increased Lin28a protein level in L4/5 DRGs 1 or 3 days after SNI.
(C) Quantification of (B) (one-way ANOVA followed by Tukey’s multiple comparisons test, p = 0.0211, n = 3 independent experiments).
(D) Top: timeline of the experiment. Bottom: representative images showing that simultaneous knockdown of Lin28a/b impaired sensory axon regeneration in vivo. The right column shows enlarged images of the areas in the dashed white boxes on the left. The red line indicates the crush sites. Red arrows indicate axonal tips. Scale bar, 1 mm (left) and 0.5 mm (right).
(E) Quantification of (D) (unpaired Student’s t test, p = 0.0064, n = 6 mice in each group)
(F) Representative western blot result showing a markedly increased hLin28b protein level in L4/5 DRGs of hLin28b mice 2 days after induction of hLin28b by dox.
(G) Top: timeline of the experiment. Bottom: representative images showing that hLin28b overexpression promoted sensory axon regeneration in vivo. The right column shows enlarged images of the areas in the dashed white boxes on the left. The red line indicates the crush sites. Red arrows indicate axonal tips. Scale bar, 1 mm (left), 0.5 mm (right).
(H) Quantification of (G) (unpaired Student’s t test, p = 0.0004, n = 7 and 6 mice in the control group and hLin28b overexpression group, respectively).
(J) Top: timeline of the experiment. Bottom: representative images showing that Lin28a overexpression promoted sensory axon regeneration in vivo. The right column shows enlarged images of the areas in the dashed white boxes on the left. The red line indicates the crush sites. Red arrows indicate axonal tips. Scale bar, 1 mm (left), 0.5 mm (right).
(K) Quantification of (J) (unpaired Student’s t test, p = 0.0109, n = 6 and 7 mice in the control group and Lin28a overexpression group, respectively).
*p < 0.05, **p < 0.01, ***p < 0.001. Data are represented as mean ± SEM. KD, knockdown; DKD, double knockdown of Lin28a/b; O/E, overexpression. See also Figure S1
