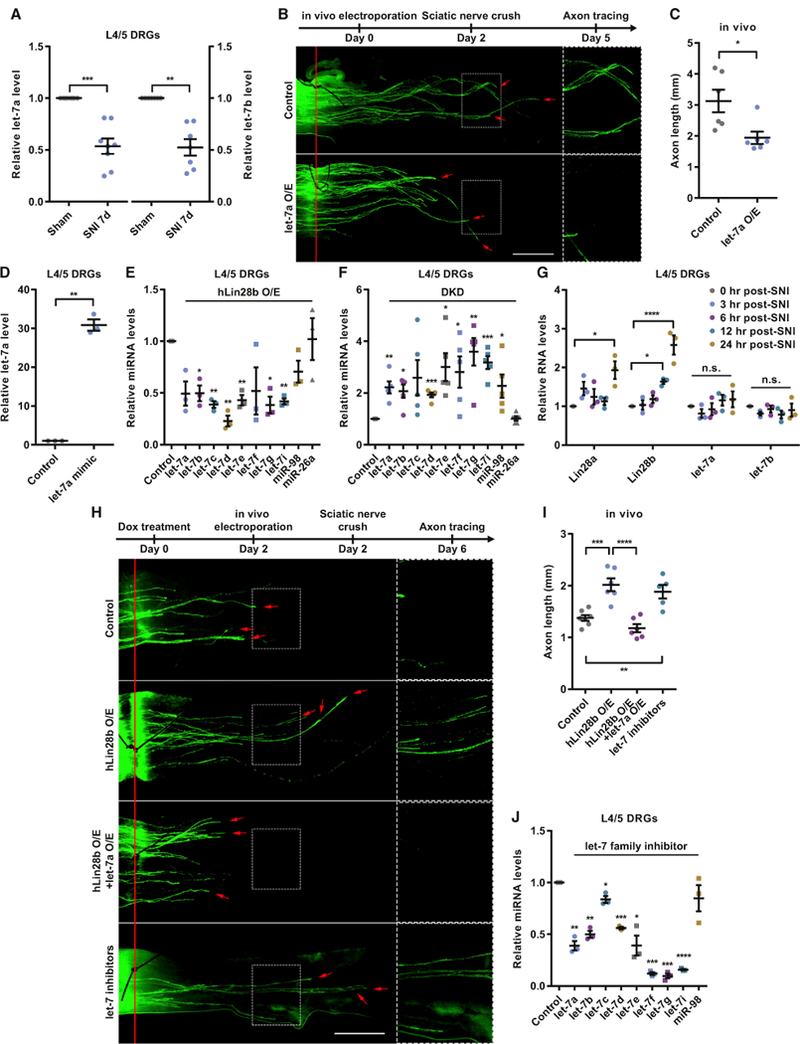
Figure 2. let-7 miRNAs Act Downstream of Lin28a/b to Regulate Sensory Axon Regeneration.

(A) let-7a/b levels were significantly decreased in L4/5 DRGs 7 days after SNI (one-sample t test, p = 0.0004 for let-7a, p = 0.0010 for let-7b, n = 8 and 7 independent experiments for let-7a and let-7b, respectively).
(B) Top: timeline of the experiment. Bottom: representative images showing that let-7a O/E impaired sensory axon regeneration in vivo. The right column shows enlarged images of the areas in the dashed white boxes on the left. The red line indicates the crush sites. Red arrows indicate axonal tips. Scale bar, 1 mm (left), 0.5 mm (right).
(C) Quantification of (B) (unpaired Student’s t test, p = 0.0175, n = 6 mice in each group).
(D) The let-7a level in L4/5 DRGs was significantly increased 2 days after in vivo electroporation of the let-7a mimic (one-sample t test, p = 0.0023, n = 3 independent experiments).
(E) The levels of let-7 miRNAs in L4/5 DRGs of hLin28b mice were decreased 2 days after induction of hLin28b by dox (one-sample t test; p = 0.0501, 0.0221,0.0029, 0.0045, 0.0074, 0.1702, 0.0167, 0.0124, 0.1090, and 0.9294 for let-7a, let-7b, let-7c, let-7d, let-7e, let-7f, let-7g, let-7i, miR-98, and miR-26a, respectively; n = 3 independent experiments).
(F) The levels of let-7 miRNAs in L4/5 DRGs were increased 2 days after DKD of Lin28a/b (one-sample t test; p = 0.0064, 0.0135, 0.0819, 0.0005, 0.0202, 0.0402,0.0082, 0.0009, 0.0474, and 0.8325 for let-7a, let-7b, let-7c, let-7d, let-7e, let-7f, let-7g, let-7i, miR-98, and miR-26a, respectively; n = 5 independent experiments).
(G) The increase of Lin28a/b mRNA levels occurred within 12–24 hr after SNI, whereas no significant change in let-7a or let-7b level was seen within 24 hr after SNI (one-way ANOVA followed by Tukey’s multiple comparisons test, p = 0.0164 for Lin28a, p < 0.0001 for Lin28b, p = 0.3634 for let-7a, p = 0.5388 for let-7b, n = 3 independent experiments).
(H) Top: timeline of the experiment. Bottom: representative images showing that let-7a O/E abolished the enhanced sensory axon regeneration induced byhLin28b O/E in vivo and that knocking down let-7 miRNAs sufficiently promoted sensory axon regeneration in vivo. The right column shows enlarged images of the areas in the dashed white boxes on the left. The red line indicates the crush sites. Red arrows indicate axonal tips. Scale bar, 1 mm (left), 0.5 mm (right).
(I) Quantification of (H) (one-way ANOVA followed by Tukey’s multiple comparisons test, p < 0.0001, n = 7 mice in the control group, n = 5 mice in the let-7 inhibitors group, n = 6 mice in the other two groups). Note that the control group and the hLin28b O/E group are identical to those in Figure 1G.
(J) Levels of let-7 miRNAs in L4/5 DRGs were decreased 2 days after in vivo electroporation of let-7 miRNA family inhibitors (one-sample t test; p = 0.0055, 0.0046, 0.0386, 0.0007, 0.0238, 0.0002, 0.0006, and 0.3509 for let-7a, let-7b, let-7c, let-7d, let-7e, let-7f, let-7g, and miR-98, respectively; p < 0.0001 for let-7i, n = 3 independent experiments).
n.s., not significant. *p < 0.05, **p < 0.01, ***p < 0.001, ****p < 0.0001 compared with the control if not designated. Data are represented as mean ± SEM. See also Figure S2.
