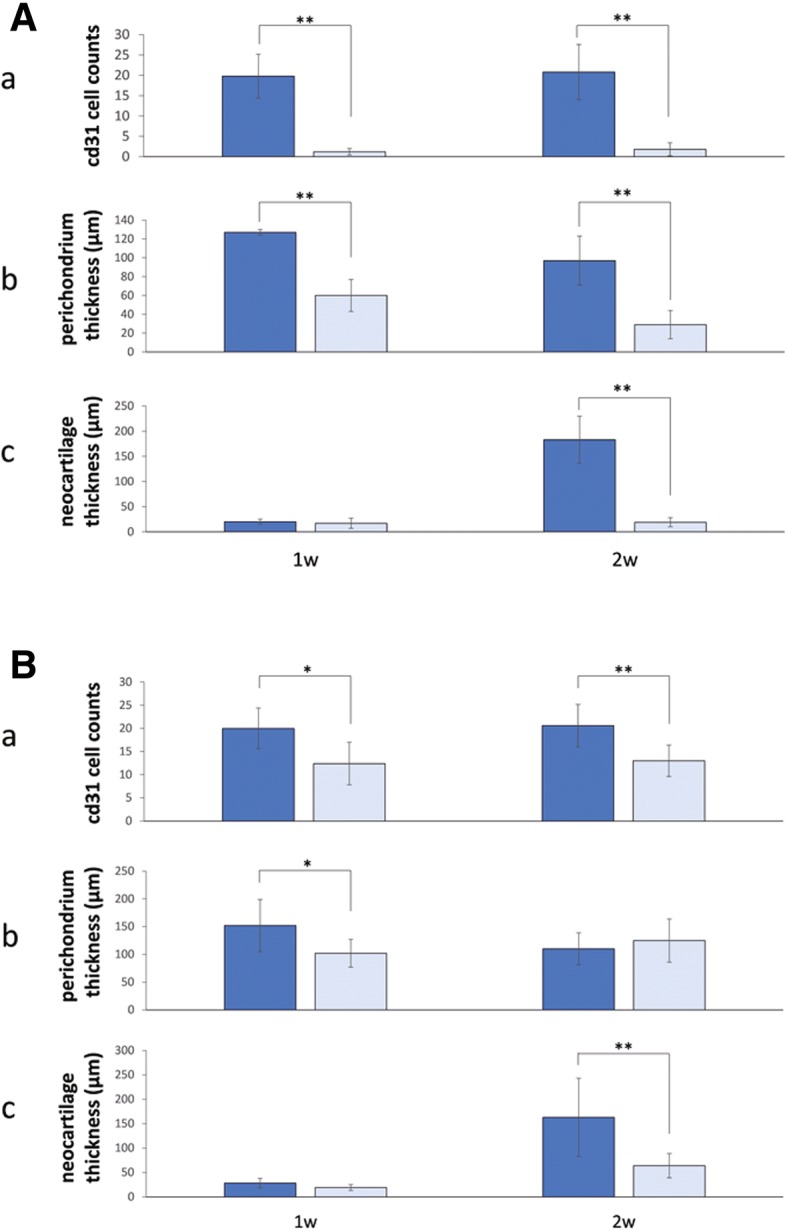
Fig. 6.

Cartilage proliferation stimulated by bFGF-induced vascularization. a. MMP inhibition. (a) Quantification of CD31-positive cells. Immunohistochemical staining with the anti-CD31 antibody was performed to evaluate angiogenesis. The graph shows the mean numbers of CD31-positive cells per visual field in the control groups (DMSO injection) and the experimental groups (MMP inhibitor injection). The differences in the numbers of CD31-positive cells between the corresponding control and experiment groups were statistically significant. **P < 0.001. (b) Perichondrium thickness. The graph shows the mean thickness of the perichondrium per microscopic visual field in the control groups (DMSO injection) and the experimental groups (MMP inhibitor injection). The differences between the corresponding control and experiment groups were statistically significant. **P < 0.01. (c) Neocartilage thickness. The graph shows the mean thickness of new cartilage per microscopic visual field in the control groups (DMSO injection) and the experimental groups (MMP inhibitor injection). The differences between the control and experimental groups at 2 weeks post bFGF-treatment showed statistically significant improvement in the experimental groups, but improvement was not observed at 1 week post treatment. **P < 0.001. b. VEGF neutralization. (a) Cell counts (CD31). The graph shows the mean numbers of CD31-positive cells per visual field in the control groups (DMSO injection) and the experimental groups (VEGF-neutralizing antibody injection). The differences in the counts of CD31-positive cells between the corresponding control and experiment groups were statistically significant. *P < 0.05; **P < 0.01. (b) Perichondrium thickness. The graph shows the mean thickness of the perichondrium per microscopic visual field in the control groups (DMSO injection) and the experimental groups (VEGF-neutralizing antibody injection). The differences between the control and experimental groups at 1 week post bFGF-treatment were statistically significant, but a significant difference was not observed at 2 weeks post treatment. *P < 0.05. (c) Thickness of neocartilage. The graph shows the mean thickness of new cartilage per microscopic visual field in the control groups (DMSO injection) and the experimental groups (VEGF-neutralizing antibody injection). The differences between the control and experimental groups at 2 weeks post bFGF-treatment were statistically significant, but no significant difference was observed at 1 week post treatment. **P < 0.001. “Reprinted with permission from (Miyanaga, A. (2017). Transient vascularization promotes proliferation and cartilage-formation of perichondrial progenitor cells. Journal of Kanazawa Medical University, 42, 24–31.). Copyright (2017) publication administration of Kanazawa Medical University”
