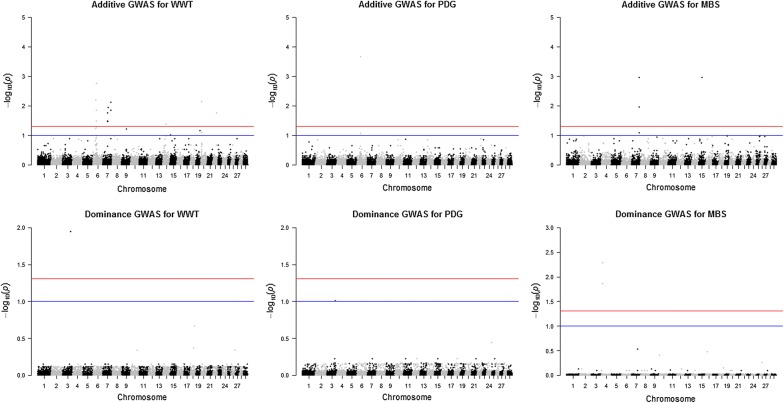
Fig. 3.
Joint genome-wide association of additive and dominance SNP effects for weaning weight (WWT; left), pre-weaning daily gain (PDG; center) and marbling score (MBS; right) evaluated in combined data (n = 6794). Significant SNPs were determined with a false discovery rate correction at 5% (red line) and 10% (blue line)

