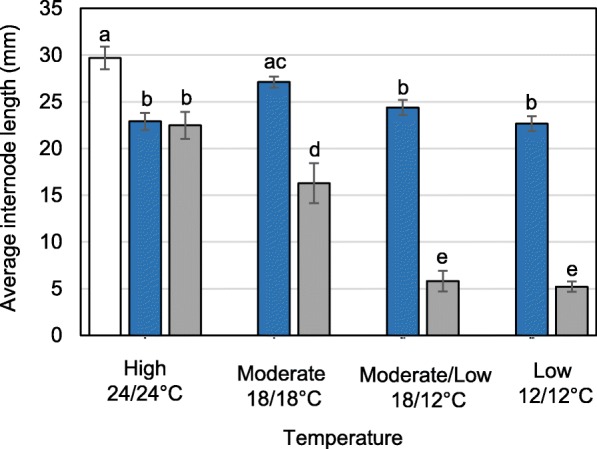
Fig. 1.

Internode elongation under short photoperiod and different temperature regimes, high (24/24 °C; D/N), moderate (18/18 °C; D/N), moderate/low (18/12 °C; D/N) and low (12/12 °C; D/N; day/night). White bar represent final internode length under long photoperiod at 18/18 °C. Blue bars represent the final length of internodes, excluding the last three, under short photoperiod and the indicated temperature regime. Grey bars represent the final internode length of the three internodes that were in the incipient stage during the start of short photoperiod. Different letters refer to statistically significant differences (p < 0.001) (values are means ± SE, n = 15 per data point)
