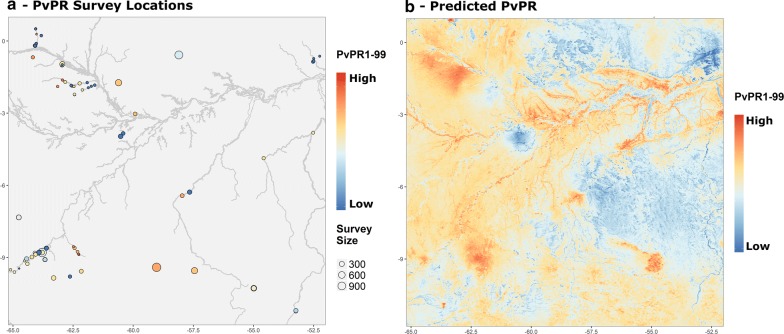
Fig. 2.
Predicting the spatial distribution of Plasmodium vivax using malariaAtlas-derived response and covariate data. a Map illustrating locations of age-standardised PvPR survey points within the study area as used for response data in mock analysis 1. River locations were downloaded from the Global Lakes and Wetlands Database [52]. b Predicted Plasmodium vivax parasite rate within the study area. Predictions are derived from a Bayesian geostatistical model using data in panel a and environmental covariates including night-time temperature, elevation and rainfall. Both maps were produced using malariaAtlas’ autoplot methods and ggplot2 [42]. Absolute values were removed from the colour scales to reflect the purely illustrative nature of this analysis

