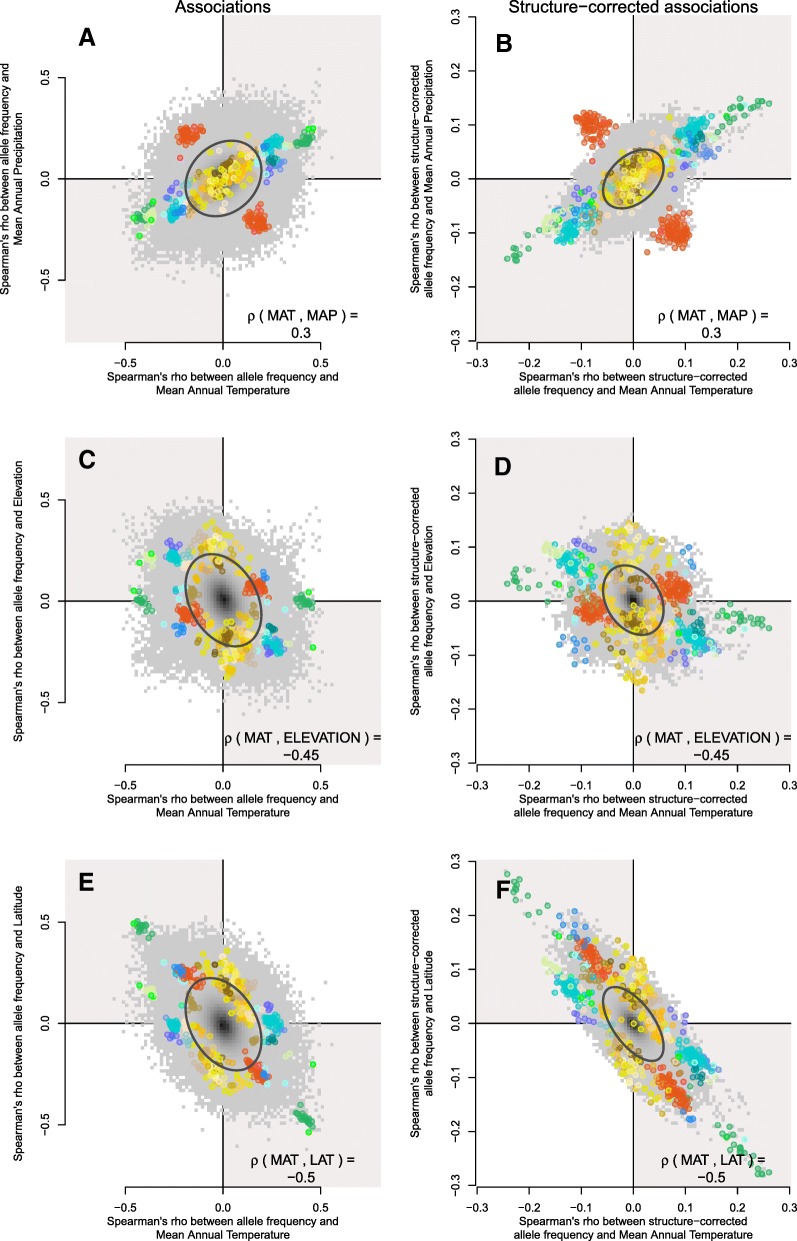
Fig. 5.
Galaxy biplots for different environmental variables for regular associations (left column) and structure-corrected associations (right column). Top candidate SNPs are highlighted against the genome-wide background. The correlation shown in the lower right corner represents Spearman's ρ between the two environmental variables on the landscape. The internal color of each point corresponds to its co-association module (as shown in Fig. 2c–f). Top row: mean annual temperature (MAT) vs. mean annual precipitation (MAP), middle row: MAT and elevation, bottom row: MAT and latitude (LAT)

