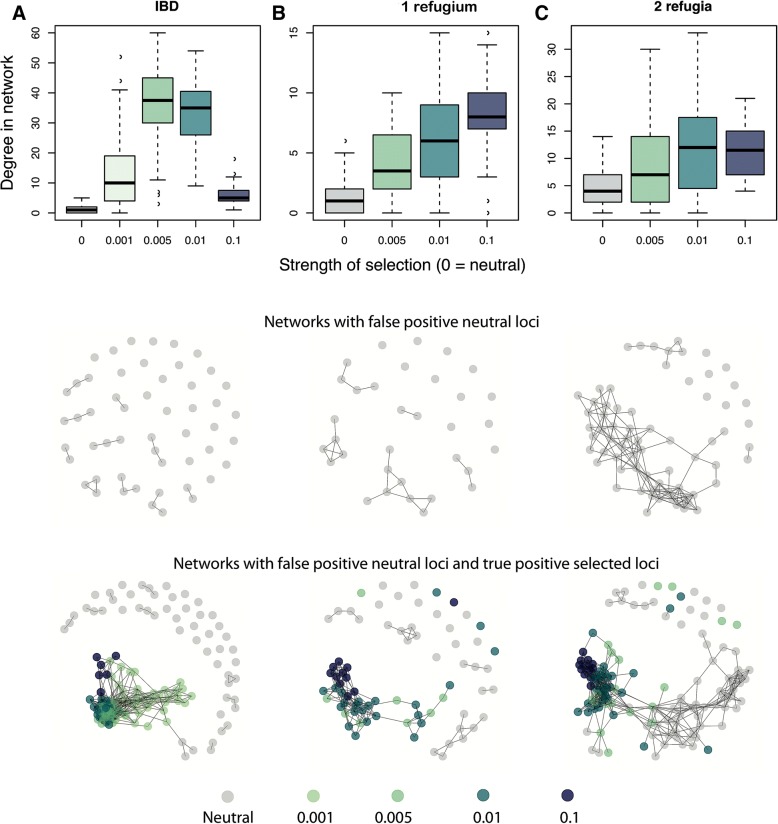
Fig. 8.
Comparison of co-association networks resulting from simulated data for three demographic scenarios. a Isolation by distance (IBD), b range expansion from a single refugium (1R), and c range expansion from two refugia (2R). All SNPs were simulated unlinked and 1% of SNPs were simulated under selection to an unmeasured weak latitudinal cline. Boxplots of degree of connectedness of a SNP as a function of its strength of selection, across all replicate simulations (top row). Examples of networks formed by datasets that were neutral-only (middle row) or neutral+selected (bottom row) outlier loci

