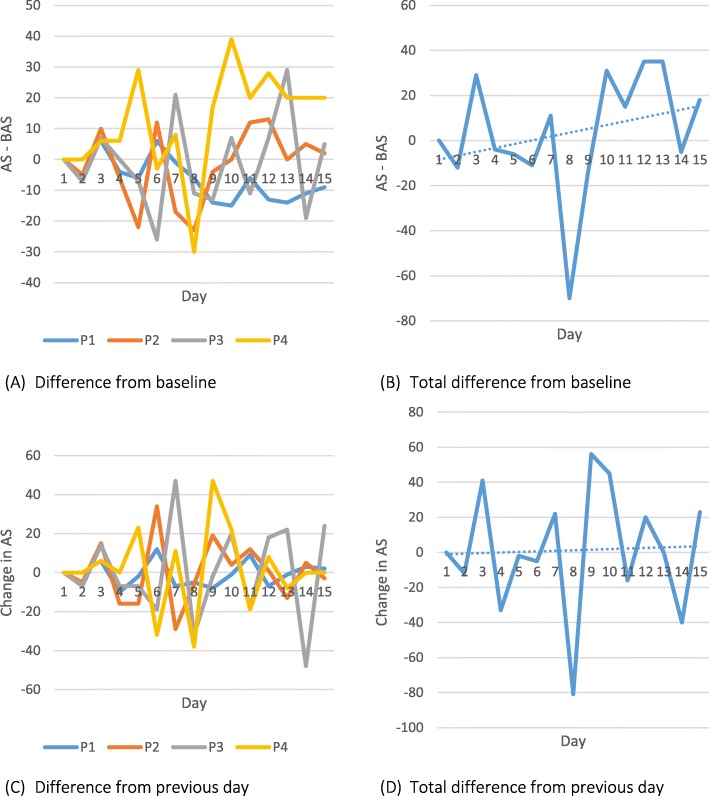
Fig. 7.
Graphs showing different analysis metrics of activity score (AS) from participant 1029 (Pilot RCT-Feedback Group). Graphs (a) and (b) show the difference in AS from baseline AS (BAS). Graphs (c) and (d) show the difference in AS from the previous day’s values. P1 to P4 refer to each 2-h time period between 08:00 and 16:00

