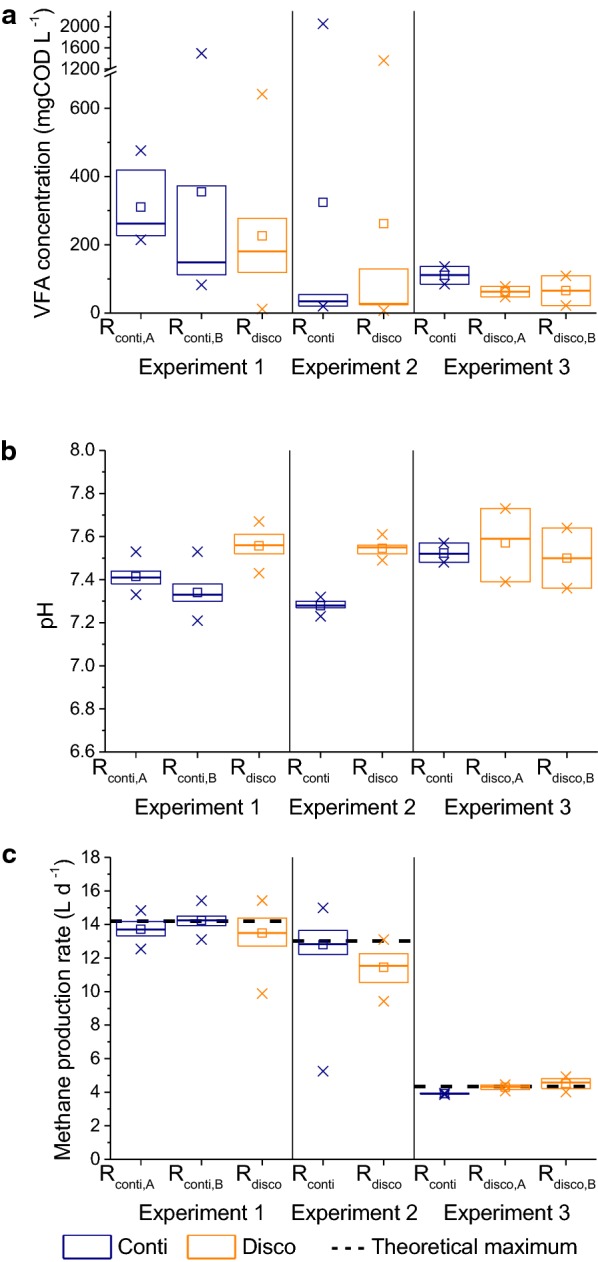
Fig. 2.

Process performance at the end of the training phase of each experiment. Biological replicates are designated as “A” and “B”. Box plots include all samples from 3 HRTs after the start of the training phase until the end of the training phase. a Total VFA concentration, b pH, c experimental methane production rates and theoretical maximum methane production rate assuming complete conversion of all VFAs to methane. Boxes represent the 25–75% percentiles, solid lines the median, squares the average, x the max and minimum, and dashed lines the theoretical maximum
