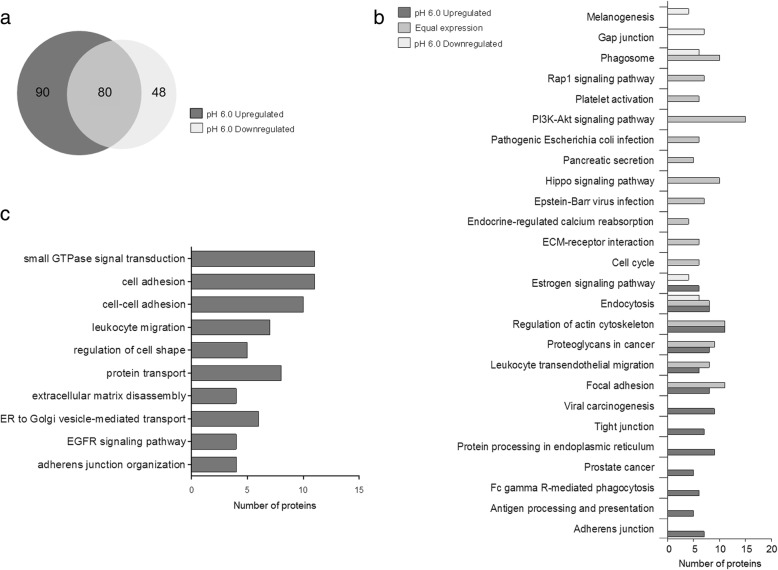
Fig. 5.
Proteome characterization by HPLC-MS/MS of control and pH 6.0 exosome obtained after ultracentrifugation. a Venn diagram depicting the overlap of upregulated and downregulated pH 6.0 proteins with respect to control condition. b Functional analysis of the downregulated, equally expressed and upregulated proteins at pH 6.0. Only over-represented metabolic pathways with P ≤ 10− 2 were considered. c GO enrichments of pH 6.0 upregulated proteins. Only over-represented categories with P ≤ 10− 2 were considered

