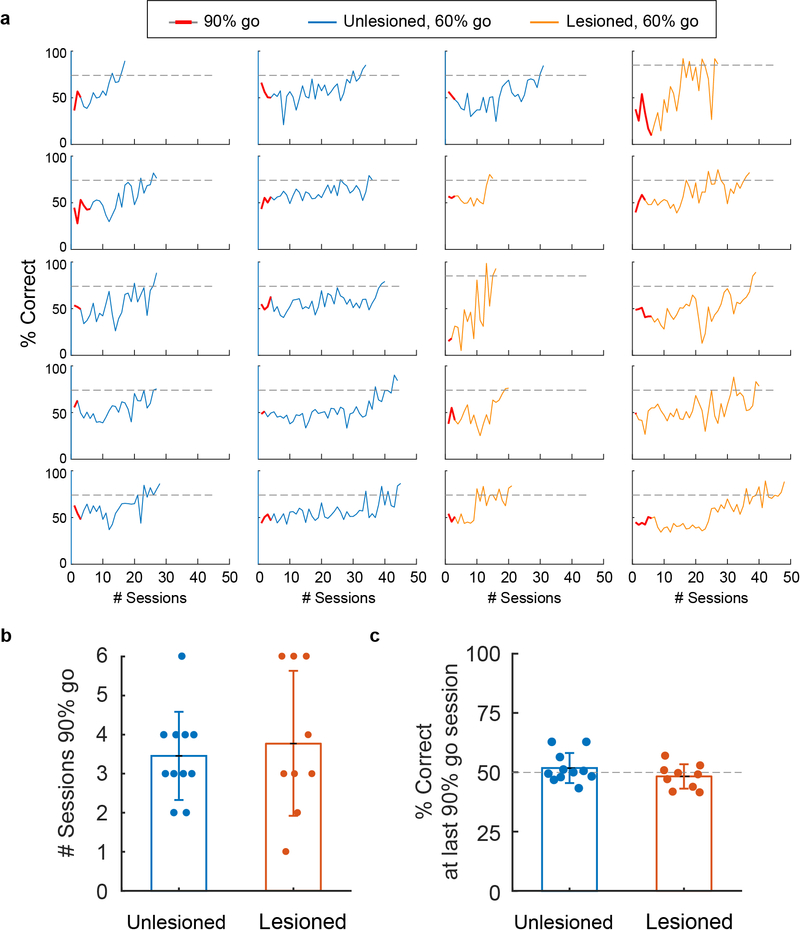
Extended Data Figure 7 |. Learning curves for unlesioned and lesioned mice in learning experiment.
a, Individual learning curves for unlesioned (n=11, blue lines) and contralateral barrel cortex lesioned mice (n=9, orange lines) that learned the detection task to criterion (74% correct performance for 2 consecutive sessions). Animals were first introduced to the pole with 90% go trials (red lines). This intermediate step ensured that animals maintained a stable weight before moving on to the last step of training. Mice were moved onto 60% go trials for the rest of the learning assessment. Animals were given 48 sessions to learn the task, b, Unlesioned and lesioned groups spent similar time on 90% go sessions (3.8±1.8 vs. 3.5±1.1 sessions for unlesioned and lesioned mice, respectively, p = 0.63). c, By the end of the 90% go sessions, animal performance was still at chance levels (p=0.34, p = 0.37 for unlesioned and lesioned mice, respectively, one-sample t-test).

