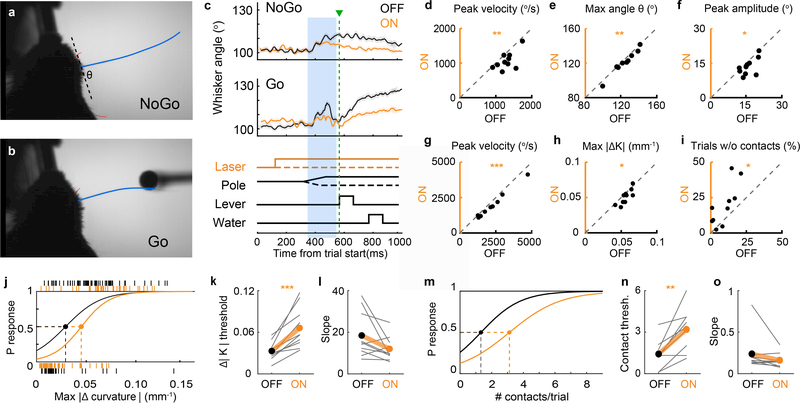
Figure 2 |. Transient optogenetic inactivation of barrel cortex alters whisking kinematics and sensory threshold.
a, High-speed video frame depicting traced C2 whisker during nogo trial (pole moves away); and b, go-trial (pole within whisker reach). Whisker position was measured as its angle (θ) relative to the face. The whisker bends upon contacting pole, changing whisker curvature. c, Average whisker angle for nogo and go trials for an example session. A 200-ms window (blue shaded area), from when the pole was within reach and before the response, was analyzed. Green: average response time. Whisking kinematics for each animal during nogo trials: d, peak angular velocity of whisker protraction; e, maximum whisker angle; and f, mean peak whisking amplitude. For go trials: g, peak angular protraction velocity, h, average maximum change in curvature (ΔΚ), and i, % of trials without any contacts. j, Logistic regression of response probability given max Δcurvature for an example session. Tick marks indicate responses (0 for no response; 1 for lever response) on individual trials. Detection threshold was defined as the value at which response probability is 0.5. k, Detection threshold for maximum ΔΚ, and l, slope (sensitivity) for each animal. m, Logistic regression of response probability against number of contacts/trial for an example session. n, Detection threshold for number of contacts and o, slope.

