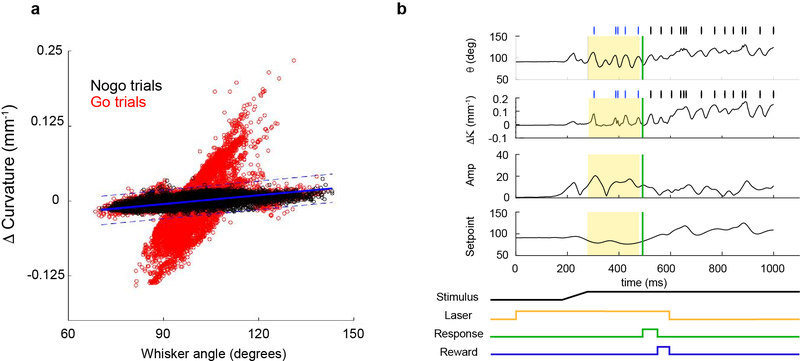
Extended Data Figure 3 |. Defining contacts based on whisker angle and change in curvature.
a, Example curvature versus whisker position for a single session. Each circle represents the paired values for curvature and whisker angle for each frame during the session. Values for nogo trials define whisker parameters during free whisking in air, when no contacts can be made (black); and go trials are shown in red. Linear regression was used to define the line of best fit (blue, solid line) for nogo parameters, and upper and lower contact thresholds were set by finding the offsets that encompassed the no-contact parameter space (1–5 standard deviations from the line-of-best-fit, blue dotted lines). b, Putative contacts were defined as points at which the local maxima or minima of the change in curvature were above (forward contact with whisker) or below (reverse contact with whisker) the defined thresholds (tick marks). Whisking analysis was restricted to the 200-ms time window (yellow shaded area) during sampling, before the response (green).

