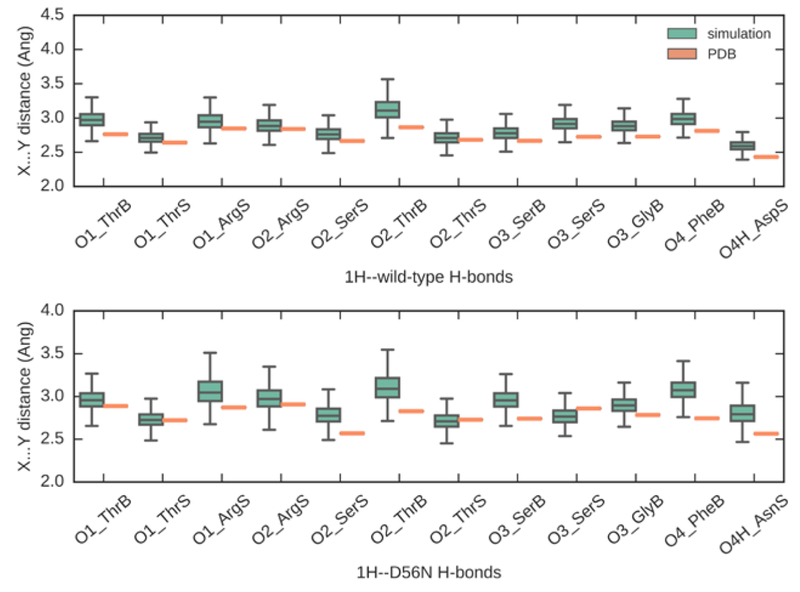
Figure 3.
Plot of 12 hydrogen bond distances (X…Y) between 1H phosphate and heavy atoms in wild type (top) and D56N mutant (bottom) PBP receptors. The orange symbols represent the distances in crystal structures and the green boxes represent the average distances in simulations with standard deviations. X axis lists all interacting residues in PBP. Suffix “S” stands for sidechain and “B” stands for backbone. In simulations, 1H phosphate reproduced and maintained 12 hydrogen bonds in both binding pockets and the H-bond distances are consistent with the experimental values

