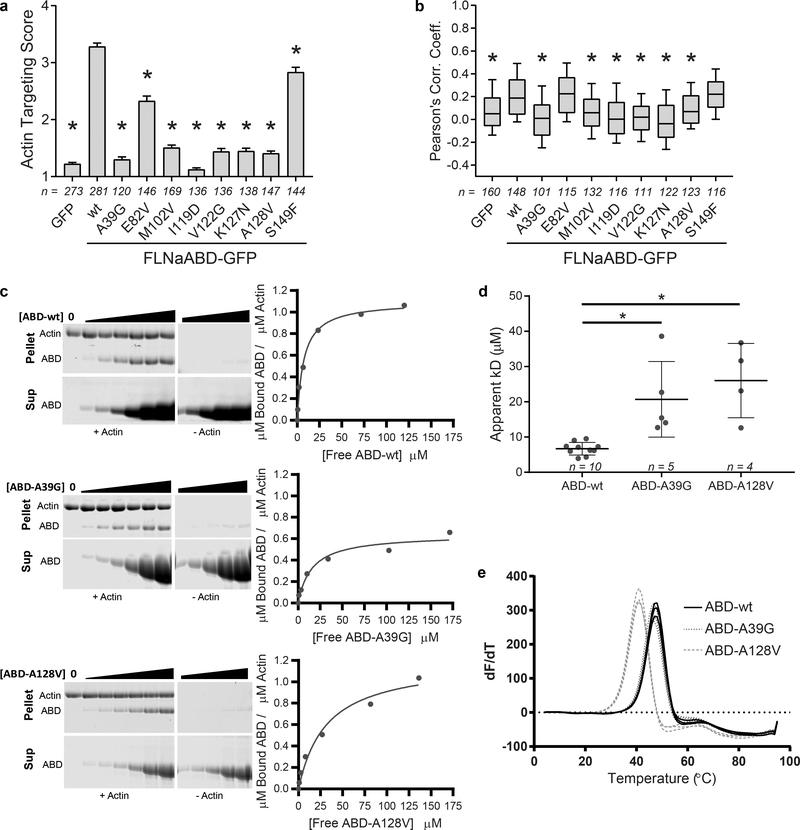
Figure 6. FLNaCH1 domain mutations confer a loss-of-function to F-actin binding.
a F-actin targeting scores of periventricular nodular heterotopia disease mutant FLNaABD-GFP. Bars = mean ± SEM, n=number of scored cells from at least 3 independent experiments, n = number of scored cells from at least 3 independent experiments, * significantly different from wt (P<0.001) in a one-way ANOVA (F9,1680=227.5) with Dunnett’s multiple comparisons test. b PCC scoring of periventricular nodular heterotopia disease mutant FLNaABD-GFP. Center = median, boxes = 25th-50th and 50th-75th percentile, whiskers extend to 10th and 90th percentiles, n = number of scored cells from at least 3 independent experiments, * significantly different from wt (P<0.001) in a one-way ANOVA (F9,1234=27.64) with Dunnett’s multiple comparisons test. c Left, representative Coomassie-stained actin co-sedimentation assay gels containing pellet (top) or supernatant (bottom) samples with no-actin controls (middle) for purified wt, A39G, and A128V FLNaABDs. Uncropped gel images are shown in Supplementary Data Set 1. On the right, assay data points were plotted to generate a binding curve to calculate an apparent dissociation constant (Kd). d Apparent Kd was averaged for FLNaABD-wt, -A39G, or -A128V protein from at least four assays (wt here is the same as appears in Fig. 5g for comparison purposes). Bars = Mean ± SEM, n = number of independent co-sedimentation assays, * significantly different from wt in an unpaired two-tailed t-test (wt vs. A39G, t=4.163, df=13, P=0.0011; wt vs. A128V, t=5.934, df=12, P<0.0001) (see also Supplementary Fig. 4d). e Triplicate derivative melting curves from differential scanning fluorimetry for purified wt, A39G, and A128V FLNaABDs indicate a single melting temperature peak for each protein (wt here is the same as appears in Fig. 5e for comparison purposes): wt = 48.1 ± 0.6 °C, A39G = 47.3 ± 0.5 °C, A128V = 42.0 ± 0.9 °C (± SD).

