Figure 5.

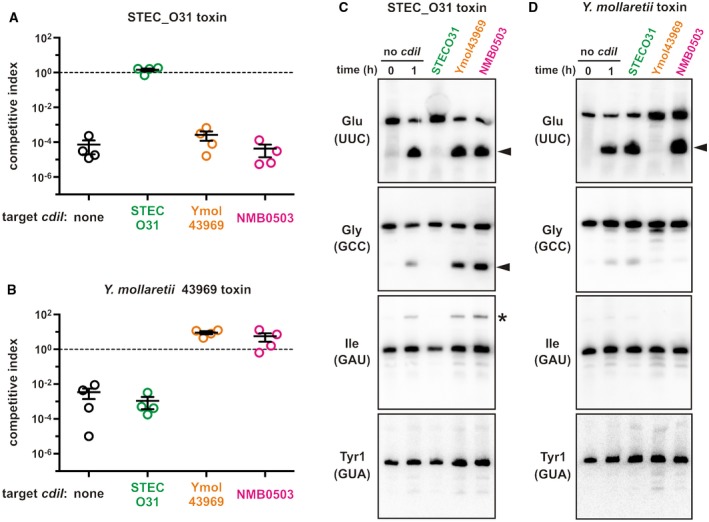
Specificity of CdiI immunity function. E. coli inhibitor strains that deploy CdiA‐CTSTECO31 (panel A) or CdiA‐CTYmo43969 (panel B) were cultured at a 1:1 ratio with E. coli target cells that express the indicated cdiI immunity genes. Viable inhibitor and target bacteria were enumerated as colony forming units (cfu) at t = 0 and after 1 h of co‐culture CDISTECO31 competitions (panel A) and 3 h for CDIYmo43969 competitions (panel B). The competitive index = (cfut = final targets/cfut = final inhibitors)/(cfut = 0 targets/cfut = 0 inhibitors). Competitive indices for four independent experiments are reported together with mean ± standard error. Northern blot analysis of total RNA isolated from CDISTECO31 (panel C) and CDIYmo43969 (panel D) competition co‐cultures. One sample was collected immediately after mixing (t = 0 h) and all other samples were collected after 1 h of co‐culture. Carets indicate cleavage products, and the asterisk indicates an incompletely processed tRNAGAU Ile transcript that accumulates in CdiA‐CTSTECO31 intoxicated cells. [Colour figure can be viewed at http://wileyonlinelibrary.com]
