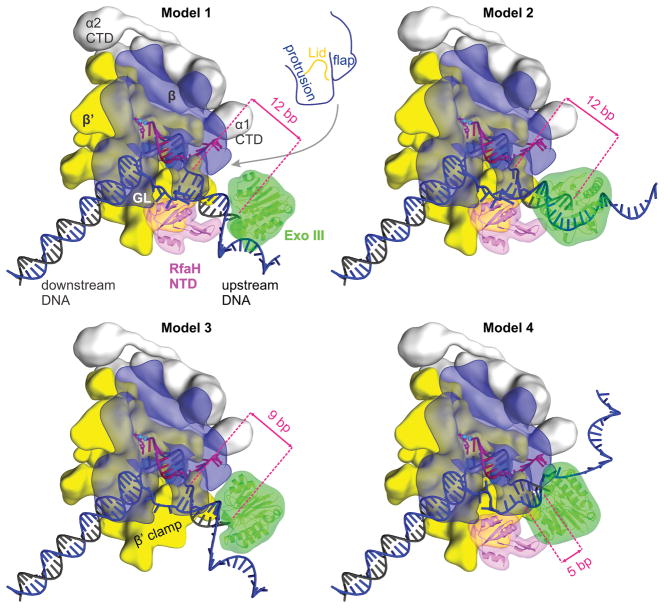
Figure 4.
Modeling Exo III approach to the EC.
Models of the Exo III digesting the upstream duplex DNA in different ECs (see the main text and for details). The EC components, RfaH, and Exo III are depicted as in Figure 1. Numbers indicate distances from the Exo III active site to the upstream fork junction. Supplementary Information Fig. S6 shows alternative views of the models, which can also be viewed as 3D PDB models (see Supplementary Information).

