
Figure 7. Exclusive production of neonatal protein isoforms attenuates Hippo signaling, activates gene expression, and promotes hepatocyte proliferation.
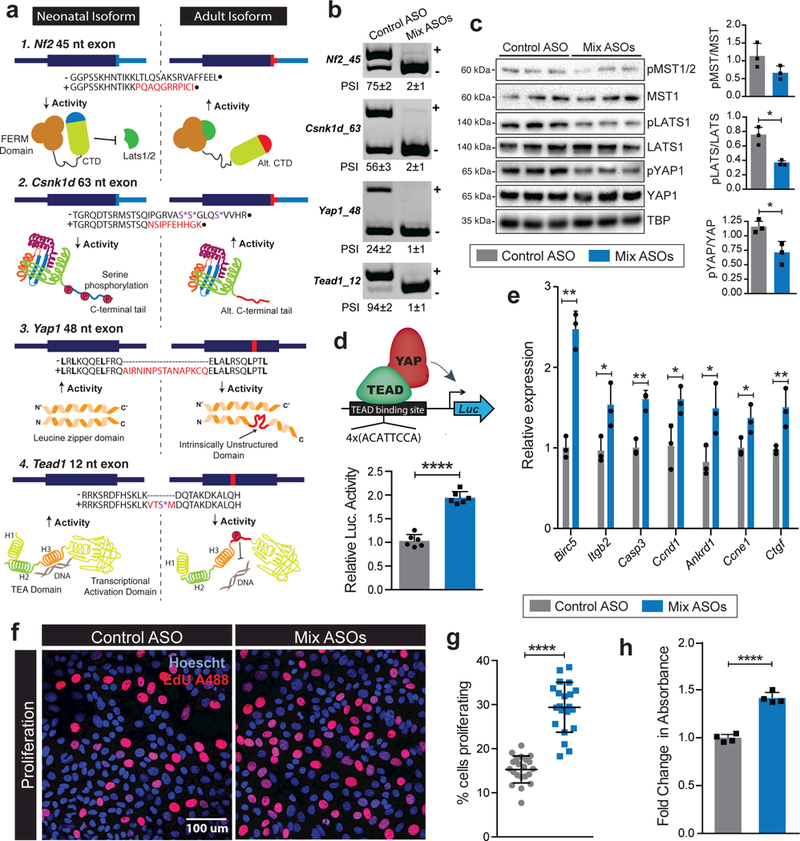
a,Cartoons representing the impact of alternative exons on structure, activity and function of core Hippo pathway proteins: NF2, CSNK1D, YAP1 and TEAD1. Red bar shows the relative location of alternative exon within individual transcripts. (−) and (+) signs show exclusion (neonatal) and inclusion (adult) isoform amino acid (AA) sequences. The AA sequences encoded by alternative exons are indicated in red. Residues highlighted with purple asterisk can be phosphorylated under specific conditions. Red regions within adult protein cartoons signify the location of peptide segment encoded by respective alternative exons. b, Simultaneous skipping of Nf2, Csnk1d, Yap1 and Tead1 alternative exons in AML12 cells after treatment with a mixture of antisense oligonucleotides (ASOs). The band corresponding to (+) indicate exon inclusion and (−) indicate exon skipping. c, Western blots of core Hippo pathway proteins and their phosphorylated forms, and quantification of phosphorylated to total protein ratios in AML12 cells following treatment with control or mixture of Hippo targeting ASOs (n=3). d, Schematic (top) and relative luciferase activity (bottom) derived from the TEAD reporter construct transfected in AML12 cells following treatment with control or mixture of Hippo targeting ASOs. All values (mean ± s.d) were normalized to β-galactosidase activity produced from a co-transfected control plasmid (n=6). e, Relative mRNA expression of indicated Hippo target genes normalized to Tbp (qPCR, ), f-g, representative images (f) and quantification (g) of EdU labeling, and h, MTT assay based quantification of AML12 cell proliferation following treatment with control or mixture of Hippo targeted ASOs (n=6). Data are mean ± s.d; *p<0.05, **p<0.01, and ****p<0.0001 from unpaired two-tailed t-test. All uncropped gel images are provided in Supplementary data set 1.