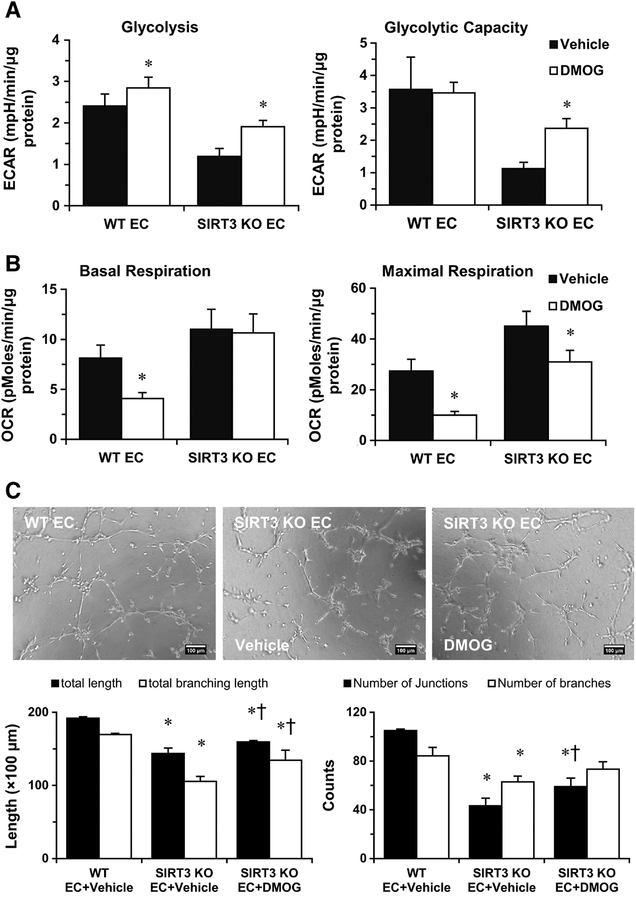
Figure 3. DMOG treatment improves glycolytic function and angiogenesis of SIRT3 KOECs.
A, Glycolysis data are calculated and expressed as extracellular acidification rate (ECAR). Glycolysis and glycolytic capacity in SIRT3 KO-ECs are rescued by the treatment of DMOG (1 mM). B, Treatment with DMOG results in a decrease in maximal respiration in WT-ECs and SIRT3 KO-ECs. However, the basal OCR remains unchanged in SIRT3 KO-ECs. *p<0.05 vs. corresponding vehicle. C, EC tube formation was assessed using a Matrigel assay. Images represented WT and SIRT3 KO-EC network formation at 6 hours of incubation. Quantifications of EC network formation reveals a significant decrease in total length and number of junctions for SIRT3 KO-ECs versus WT-ECs. In the presence of 1 mM DMOG, SIRT3 KO-ECs network formation is improved at 6 hours, as indicated by a significant increase in the number of total branching length in the DMOG treated group. *p<0.05 vs. WT-EC+Vehicle. †p<0.05 vs. SIRT3 KO-EC+Vehicle. Data are representative of 3 independent experiments.

