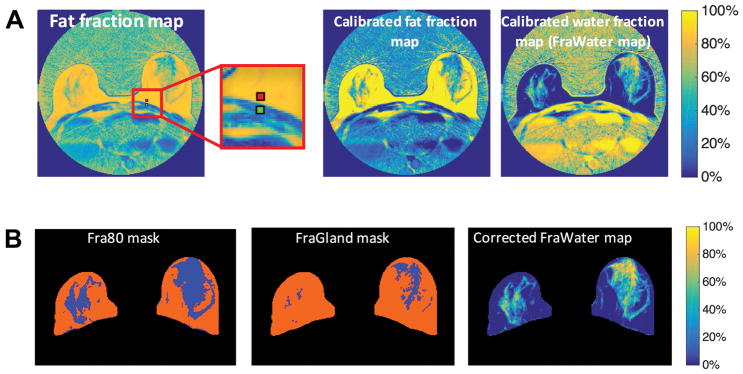
Figure 2.
Fat-water decomposition MRI-based breast density estimation. A, correction for the signal intensity bias to calculate FraWater, the original fat fraction map (left), and the corresponding calibrated fat fraction map (middle) and calibrated FraWater map (right). The red and green regions in the original fat fraction map (left) represent the subcutaneous fat and muscle regions used for calibration, respectively. B, breast density measures. Fra80 mask (left), FraGland mask (middle), and FraWater map after correction for fat-water signal contamination (right). Blue regions in Fra80 mask (left) and FraGland mask (middle) indicate the dense areas with <80% fat fraction and the fibroglandular tissue, respectively.

