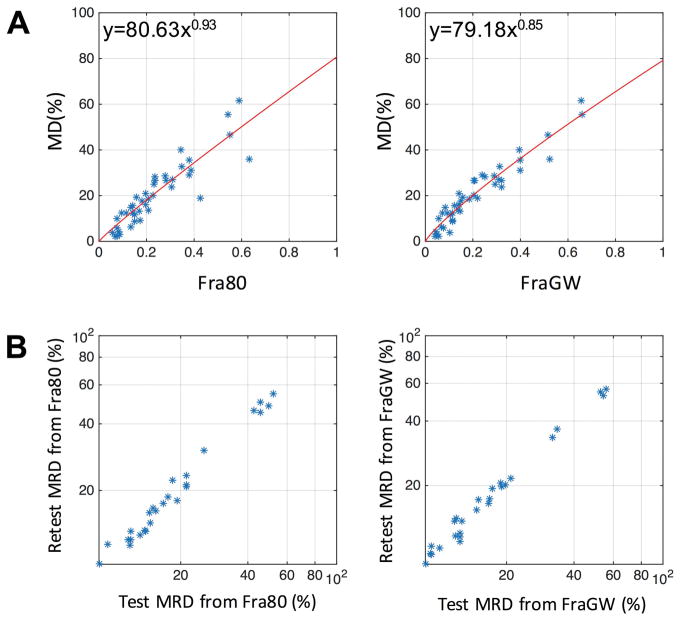
Figure 3. Concordance and test-retest reproducibility assessment.
A, correlation plot between MD and Fra80 (left) and FraGW (right) based on the automated segmentation. The statistics are shown in Table 2. The red line represents the fitted calibration curve. B, test-retest reproducibility plot of MRD measures converted from Fra80 (left) and FraGW (right). The statistics are shown in Table 3.

