
Figure 4. Ectopic PS Exposure in Neurons Causes Membrane Loss at Distal Dendrites.
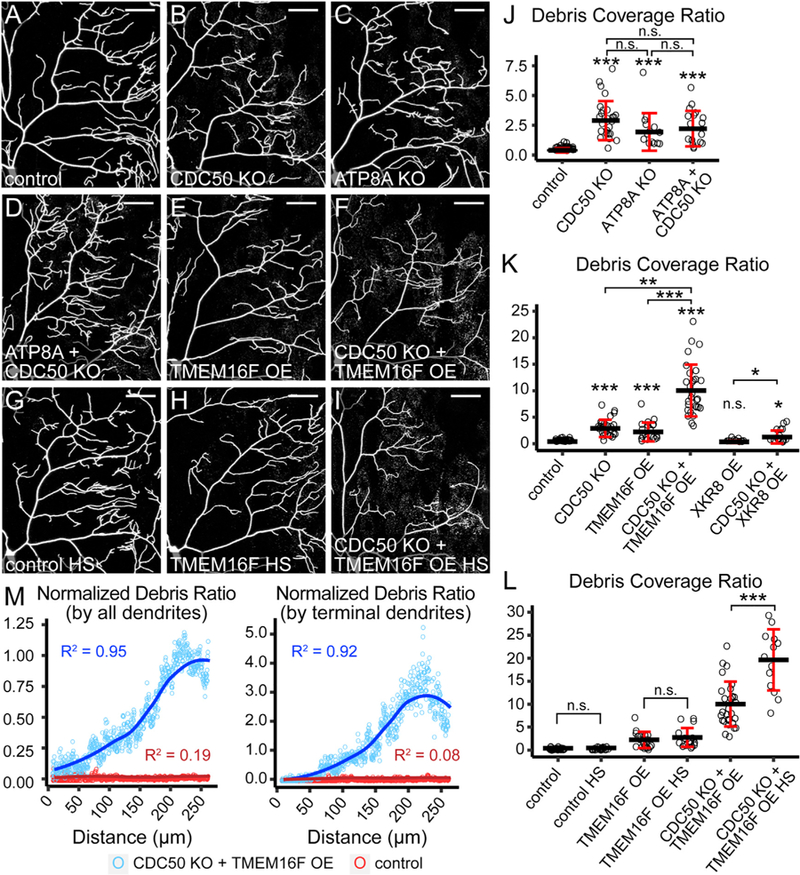
(A–F) Partial dendritic fields of control (A), CDC50 KO (B), ATP8A KO (C), ATP8A and CDC50 double KO (D), TMEM16F OE (E), and CDC50 KO + TMEM16F OE (F) C4 da neurons.
(G–I) Partial dendritic fields of control (G), TMEM16F OE (H), and CDC50 KO + TMEM16F OE (I) C4 da neurons after heat shock (HS) treatments.
(J and K) Quantification of debris coverage showing effects of flippase KO (J) and scramblase OE (K). The debris coverage ratio is debris area ratio normalized by dendrite area ratio. n = number of neurons: control (n = 35, 16 animals); CDC50 KO (n = 25, 11 animals); ATP8A KO (n = 14, 9 animals); ATP8A + CDC50 KO (n = 17, 9 animals); TMEM16F OE (n = 19, 9 animals); CDC50 KO + TMEM16F OE (n = 29, 12 animals); XKR8 OE (n = 10, 8 animals); CDC50 KO + XKR8 OE (n = 16, 9 animals).
*p % 0.05, **p % 0.01, ***p % 0.001, Kruskal-Wallis (one-way ANOVA on ranks) and Dunn’s test; p values adjusted with the Benjamini-Hochberg method.
(L)Quantification of debris coverage with or without heat shocks. n = number of neurons: control (n = 35, 16 animals); control HS (n = 23, 12 animals); TMEM16F OE (n = 19, 9 animals); TMEM16F OE HS (n = 18, 10 animals); CDC50 KO + TMEM16F OE (n = 29, 12 animals); CDC50 KO + TMEM16F OE HS (n = 13, 7 animals).
***p % 0.001, pairwise t test; p values adjusted with the Bonferroni method. n.s., not significant.
(M)Correlation between the debris ratio and the distance from the cell body in control (red) and CDC50 KO + TMEM16F OE (blue). The average debris ratio at a given distance is average debris particle number divided by either total dendrite number (left panel) or terminal dendrite number (right panel). Circle: average debris ratio; solid line: polynomial fit of the average debris ratio; R2: coefficient of determination of the linear regression. n = number of neurons: control (n = 35, 16 animals); CDC50 KO + TMEM16F OE (n = 29, 12 animals).
Scale bars: 50 mm. Black bar: mean; red bars: SD. The control in (J)–(L) is the same dataset; CDC50 KO in (J) and (K) is the same dataset; TMEM16F OE in (K) and (L) is the same dataset; CDC50 KO + TMEM16F OE in (K) and (L) is the same dataset. See also Figure S4. n.s., not significant.