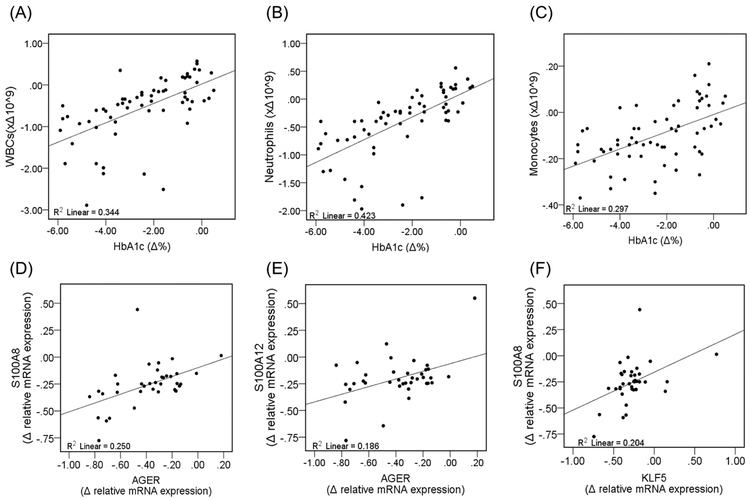
Figure 1: Correlation of Changes in WBCs and Inflammatory Markers in the Improved Diabetes Group.
WBCs were assessed using a Coulter counter to determine numbers of circulating cells. Histopaque double-density separation was also used to separate WBCs into granulocytes and mononuclear cells. Then, mRNA levels were assessed from granulocytes and mononuclear cells using qPCR. (A) There is a significant linear and positive correlation between relative changes in HbA1c and WBCs (F =8.8, p<0.01). Changes in HbA1c significantly correlated with (B) neutrophil counts (F =10.8, p<0.01), but not (C) monocytes (F=2.26, p=0.142) and lymphocytes (F=0.111, p<0.740) (data for lymphocytes are not shown). There was a significant linear and positive correlation between relative changes in AGER and (D) S100A8 (F=11.7, p<0.01) and (E) S100A12 (F=8.0, p<0.01). Relative changes in the gene expression of (F) KLF5 positively and significantly correlated with relative changes in S100A8 (F=6.3, p<0.05).

