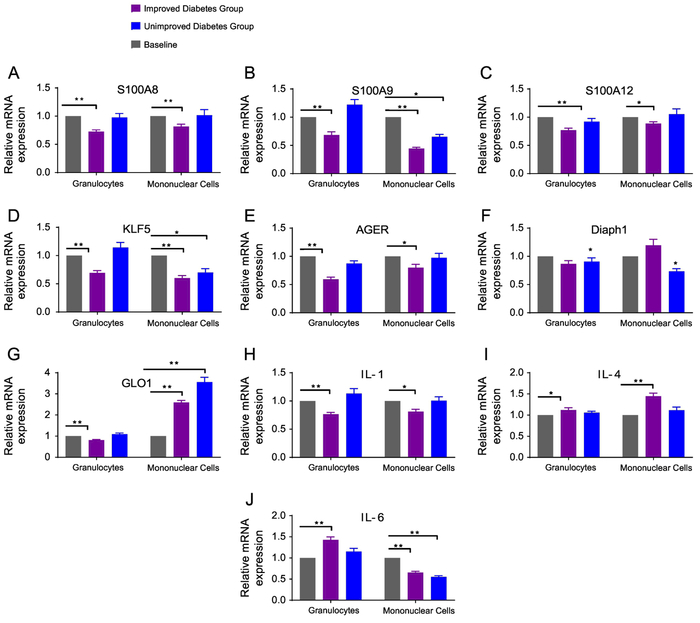
Figure 2: Relative Gene Expression of Inflammatory Markers from Granulocytes and Mononuclear Cells after 3 months of Diabetes Treatment.
Granulocytes and mononuclear cells were isolated from subjects with type 2 diabetes. Inflammatory markers from these WBCs were measured at baseline and 3 months in the improved and unimproved diabetes groups. Inflammatory markers include (A) S100A8 (B) S100A9 (C) S100A12 (D) KLF5 (E) AGER (F) Diaph1 (G) GLO1 (H) IL-1 (I) IL-4, and (J) IL-6. Data are represented as mean and SEM. All inflammatory markers are compared to a relative baseline expression of 1. * p<0.05, ** p<0.001

