
Figure 3. Combined network of morphological MRI, biomechanics, compositional MRI, and bone shape analysis.
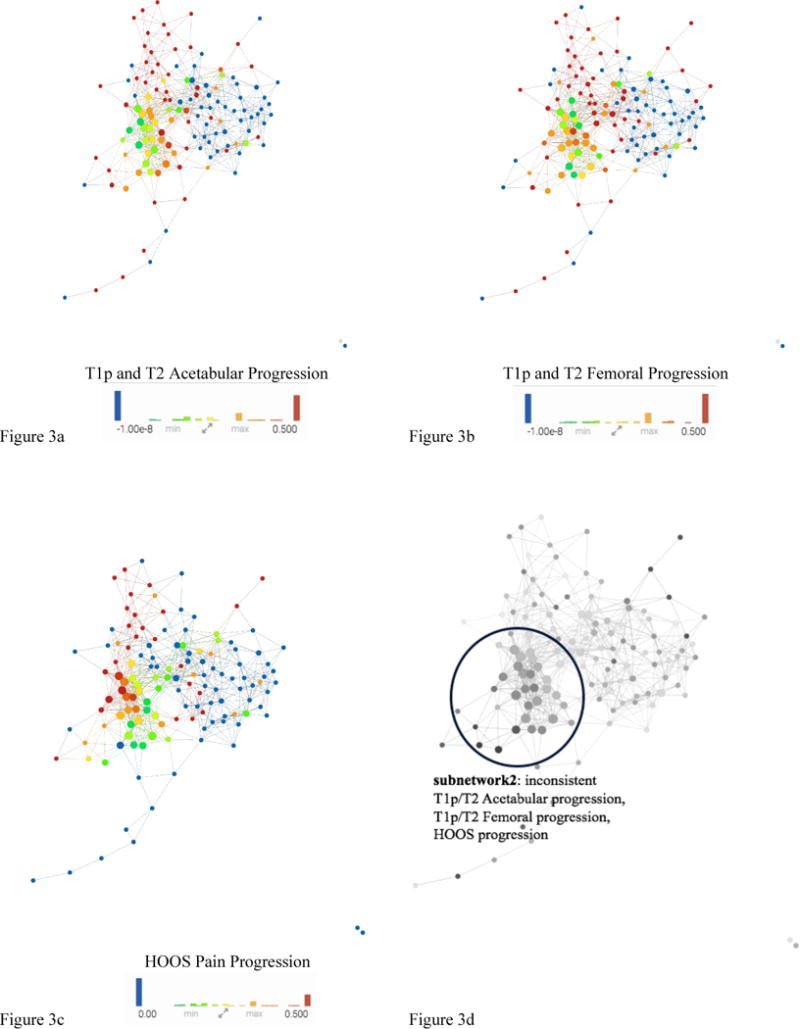
The same network is colored by (A) T1ρ and T2 Acetabular Progression, (B) T1ρ and T2 Femoral, (C) HOOS Pain Progression. Based on visual inspection of a-c: Figure 3d shows inconsistent progression patients appearing in the lower left portion subnetwork2 (circled with a blue line) and consistent progression patients in the upper part of the network.