Figure 7.
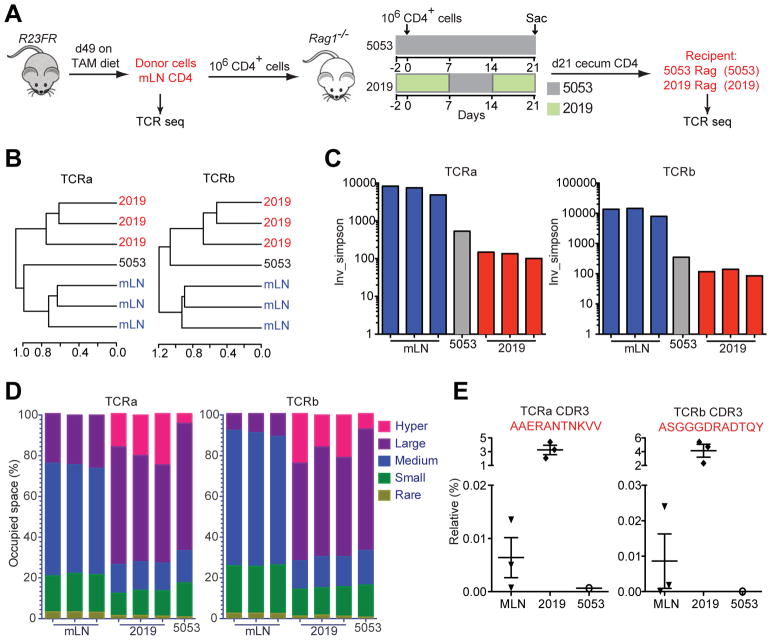
T Cell Receptor Clonality Analysis. (A) Experimental setup for TCR sequencing analysis. Note that donor cells from mLN of R23FR mice were obtained at remission stage (d49). (B) Unsupervised hierarchical clustering of TCR repertoire from donor mLN cells, cecum CD4+ T cells recovered from recipient Rag−/− mice treated with diets 5013 and 2019. N=3 individual mice in both donor group and 2019 group; n=1 of pooled 10 mice for group 5053. (C) Inverse Simpson’s diversity index was used to assess the diversity of TCR repertoires for each sample. (D) The percent of clonal space occupied by clones of a given type (classified by size, Supplementary Table 1). (E) Frequencies of selected TCRα and TCRβ clonotypes in different samples.

