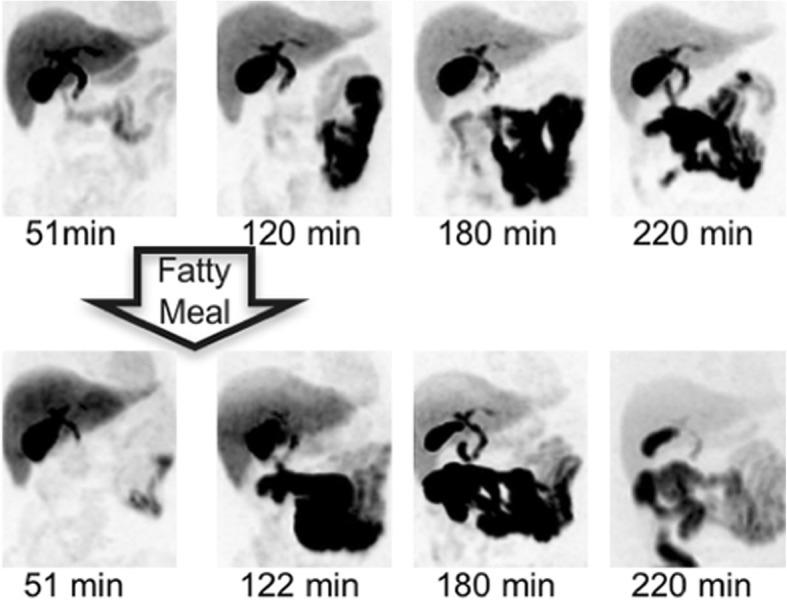
Fig. 4.

Maximum intensity pixel PET images for volunteer 8 in both control and intervention groups. Legend: The upper row of images shows the original scans, while the lower image set details the gallbladder contraction over time following a fatty meal during the volunteer’s repeat scan
