Figure 1.
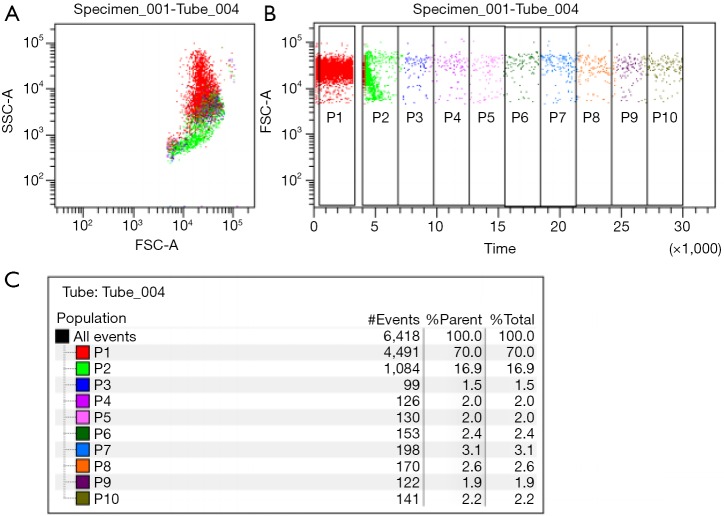
Flow cytometric osmotic fragility test (FCOF). Ratio between cells count in first (P1) and mean of two last gates [(P9+P10)/2]corrected by dilution factor indicates residual red blood cells count, which, when low, is indicative for HS. (A) Gating of red blood cells in forward scatter vs. side scatter logarithmic scale cytogram; (B) cytogram of forward scatter vs. time divided into 30 seconds gates, P1—shows cells before water addition into red blood cells suspension in saline, and gates P2–P10 show cells after water addition; (C) cells counts in appropriate gates.

