
Figure 6.
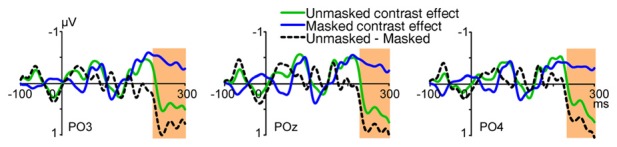
Waveforms of UVF-minus-LVF contrast effects in the unmasked (Experiment 1) and masked (Experiment 2) conditions, and the difference wave (unmasked-minus-masked). Waveforms were shown at posterior sites PO3, POz and PO4. As revealed by independent sample t-tests with sliding windows, the difference between the masked and unmasked conditions was not significant at posterior sites until 240–260 ms after stimulus onset. The orange shades indicate the interval where the difference was significant (p’s < 0.05).