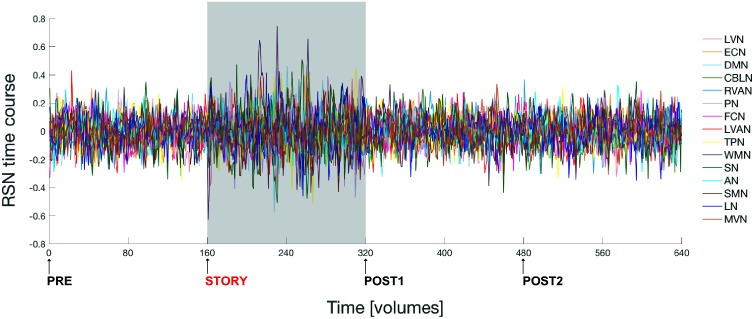
FIGURE 3.
Fluctuations of the ICA time courses associated to the 15 identified RSNs during the entire experiment. The time interval during which the naturalistic stimulus has been delivered (i.e., during story scan) is highlighted with a gray panel in the plot. Note that switching brain activity from a resting state (i.e., brain condition during the pre scan) into an active state (condition during the story scan) and then back again to resting state (post1 scan condition), over a time scale of several minutes, is associated to a marked change in the amplitude of the RSNs’ time course signals.

