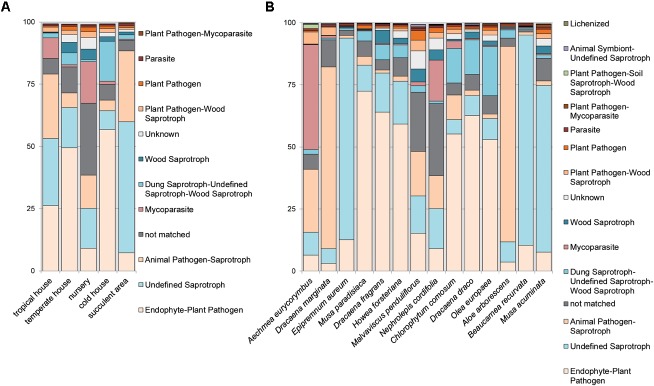
FIGURE 5.
Analysis of fungal guilds with FUNGuild per greenhouse room (A) with different microclimates and per sampled plant species (B) for the category fungal guild. Fungal guilds were filtered to >1% relative abundance. X-axis shows samples per greenhouse room or plant species, respectively. Y-axis gives counts as relative abundances [%].

