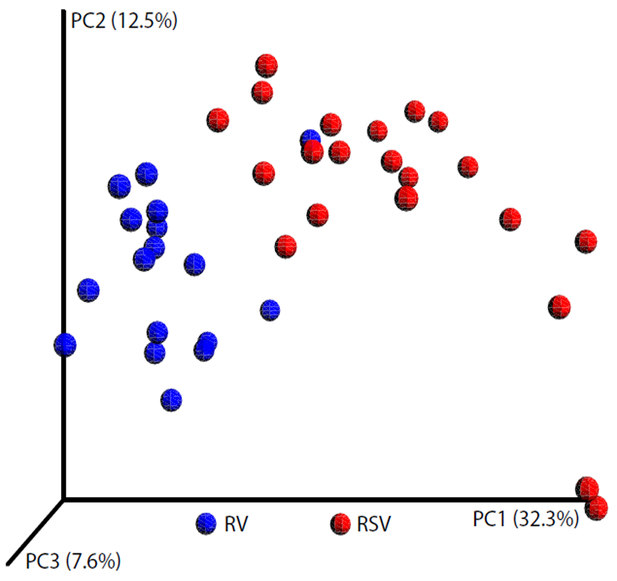
Figure 1. Principal coordinates analysis plot comparing nasal airway microRNA profiles in infants with rhinovirus bronchiolitis and those with RSV bronchiolitis.
To show the differences in nasal airway microRNA profiles among infants with bronchiolitis, principal coordinates analysis (PCoA) plot based on the Bray-Curtis distance was generated. Each dot represents the overall microRNA expression in each infant. The distance between infants indicates their dissimilarity. The PCoA revealed that infants cluster together according to their viral etiology. In addition to 16 samples with rhinovirus and 16 with RSV, six technical replicates were also included in the analysis. Abbreviations: RV, rhinovirus; RSV, respiratory syncytial virus.

