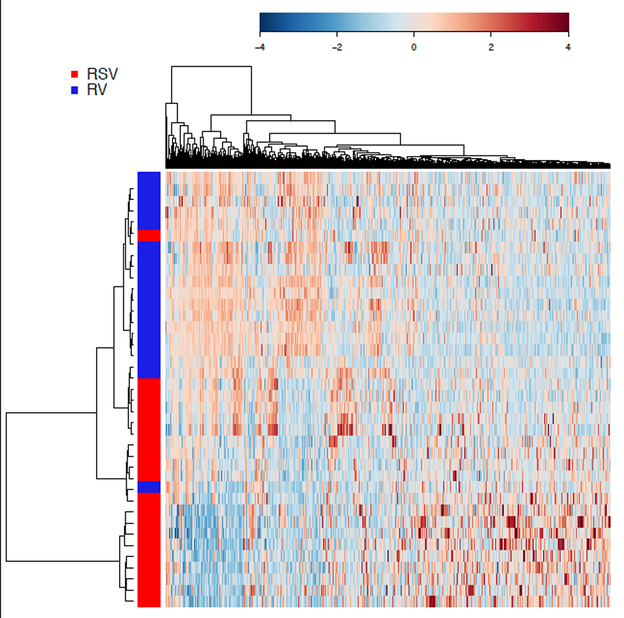
Figure 2. Unsupervised hierarchical clustering of the expression of identified microRNAs in nasal airway of infants with bronchiolitis.
The heatmap of 2,758 microRNAs that are identified in the nasal airway was generated using the Spearman’s rank correlation similarity and the Ward’s clustering algorithm. The microRNA expression profiles almost completely separated infants with rhinovirus bronchiolitis from those with RSV bronchiolitis. The color bar indicates the standardized expression of each microRNA to a mean of 0. Upregulated microRNAs have positive values and are displayed as red. Downregulated microRNAs have negative values and are displayed as blue. The differences in microRNA expression between rhinovirus and RSV are summarized in Supplemental Table S2. Abbreviations: RV, rhinovirus; RSV, respiratory syncytial virus.

