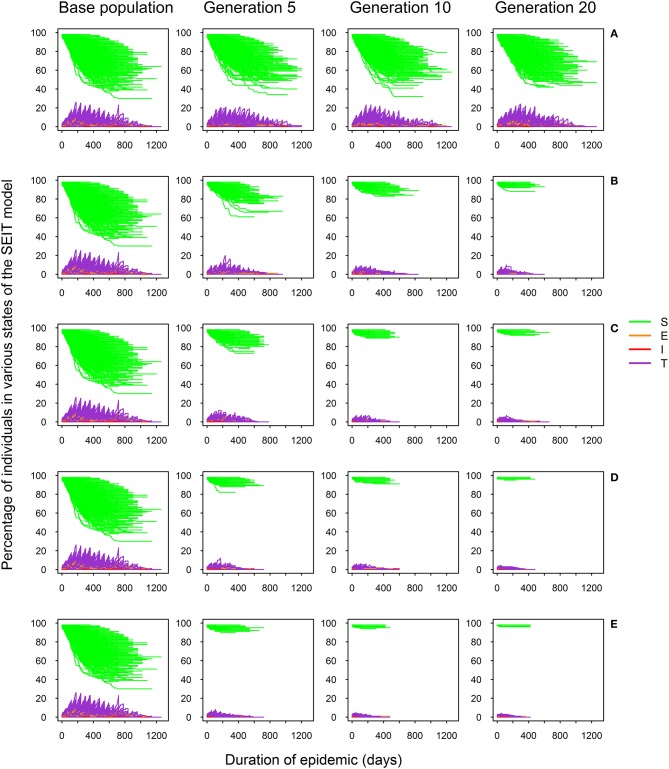
Figure 2.
SEIT model profiles across 20 generations for five selection intensities defined by the percentage of selected sires: 100% (no selection; A), 70% (B), 50% (C), 25% (D), and 10% (E); proportion of susceptible (S), exposed (E), infectious (I), and test-sensitive (T) individuals during the course of the epidemic.

