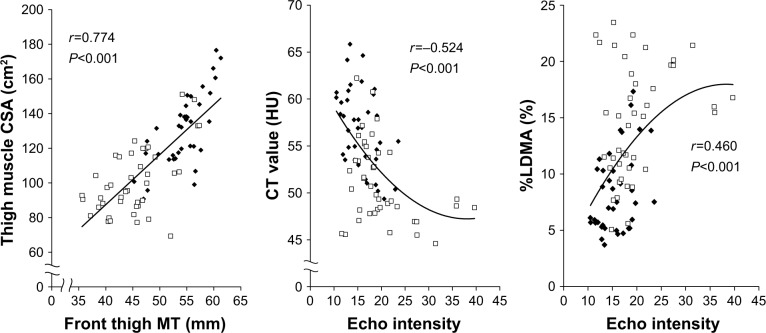
Figure 2.
Relationships between MT and CSA (left), between EI and CT value (center), and between EI and %LDMA (right) (n=40, 80 legs).
Note: Square (□) indicates older individuals and diamond (♦) indicates young individuals.
Abbreviations: CSA, cross-sectional area; CT, computed tomography; EI, echo intensity; HU, Hounsfield units; MT, muscle thickness; %LDMA, percentage of low-density muscle area.

